AudienceData
Adserver
Best Practices
Do's and dont's when using AudienceData
How to document the accuracy?
Why introduce segments with different affinities?
Using targeting with the right conditioning
DSP
How to access data AudienceData segments in Adform
How to find AudienceData in MediaMath DMP
How to find segments in BidTheatre
How to find segments in Display & Video 360
Data Introduction
Available Segments
Existing integrations
Methodology and precision
The distinction between campaign impression profile and impressions in target group
What is deterministic data?
What is probabilistic data?
Publisher
Accessing targeted data with DFP Audience sync
AdForm publisher integration instructions
How to find data usage information in Google 360 for Publishers former DFP
How to report on AudienceProject segment usage in DFP
Inventory available for realtime targeting in DFP
Lotame integration
Sending targeting key values to AdManager
Troubleshooting
AudienceHub
How to create your first audience
How to create your first seed
Case 1: Selecting a customer file
Case 2: Selecting an Amazon S3 file
Case 3: Selecting survey data from UserReport
Creating a seed
Insights reports
What is AudienceHub?
The new generation of AudienceReport
API Documentation
API Best Practices
How do I use the AudienceReport Next API?
Understanding the API documentation
What is an API?
Where do I find the API key?
Account Management
Account Types
Agencies: managing user access for connected accounts
How to add new clients
How to connect an Agency account to a Premium client account and vice versa
How to disconnect accounts
How to manage user accounts
User roles
What is the 2-step verification and how does it work?
Integrations
Adform
Amazon Ads
CTV and Addressable TV
Campaign Manager
DV360
Facebook/Meta
Semi-Automated integrations
TechEdge Integration
YouTube
Measurement Methodology
Pixel Implementation
Getting Started with Pixels
How do URL-Parameters work?
How to add parameters to AudienceReport pixel
How to check if your pixel is firing?
How to create a pixel?
SSL - Compliance
The GDPR parameters
What is a CACHE-Buster and why do we need it?
What is a tracking pixel?
What is the purpose of a t-code?
Setting up Pixels
Pricing
Reports
Creating and Sharing reports
How to add and export tracking pixels to your reporting items
How to add custom report items
How to duplicate a report
How to export your report
How to share your report with your client
How to understand your report
How to understand your report - Dashboard
How to understand your report - Delivery
How to understand your report - Funnel
How to understand your report - Profile
How to understand your report - Reach
How to use an exported pixel
Getting Started with Reports
The original AudienceReport
Addressable TV
Activating Addressable TV measurement
Available Addressable TV device types
How Addressable TV is measured
How to get the Addressable TV measurement tool in AudienceReport
Impact on sample size and frequency
Sharing Addressable TV measurement numbers with TechEdge
What is Addressable TV?
Adserver Implementation
Ad Tech
Adserver - Adform
Adserver - VideoPlaza
Atlas
Double Click DCM Adserver
Emediate
Extented Sizmek Asia-guide
How to implement creative wrapper in Ad Manager
Programmatic Publisher Ad Server - Adform PPAS
Setting-up video measurement in Google Ad Manager
Sizmek Ad Suite Tracking
Sizmek/MediaMind guide
Tracking using JavaScript
Implementing AudienceReport tracking pixels in Webspectators
Brand Lift Studies
Cache-buster
Is my cache-buster working?
What is a cache-buster?
Which cache buster shall I use for my ad server?
Why do we need a cache-buster?
Creating Projects
Adding tracking points / pixels to your project
Applying filters to your data
Change your target group or report period
Creating your first project
Duplicating campaigns
How to merge projects
How your data will change when applying filters
Custom Segments
Activating your Customer Segments 3.0
Available Custom Segments
Custom Segments 3.0
Custom Segments and Sample Size
Reach, Coverage and Segments Availability
What are Custom Segments?
Event Tracking
Adding tracking points / pixels with event tracking to your project
Event tracking in various adservers
Implementing click trackers
In-app tracking
In-view tracking of inlined content
Understanding Event Tracking
What is Event Tracking?
Integrated Report
Connect your Facebook Business Manager account to AudienceReport
Connect your Google Ads account to AudienceReport
Connect your Google Display & Video 360 account to AudienceReport
How are data integrated?
How to create an Integrated Report
To-do list before creating an Integrated Report
Understanding your Integrated Report
What is an Integrated Report?
Integrations
Adform integration set-up
Automatic tracking of DFP campaigns
Google Campaign Manager Integration
Integrate AudienceReport and Techedge AxM (AdvantEdge Cross Media)
Intercept
Pixel implementation
Quality
How Transparency is measured
How Viewability is measured
How the Overall Quality Score is calculated
Viewability tracking using AudienceReport measurement script
What is Quality?
What is a good Quality score?
What is a hidden referrer or a generic referrer?
What is the difference between no referrer and other referrers (in the tracking point violations table)?
When is a tracking point considered to be violating Geo Compliance/Transparency/Viewability?
Why can’t I drill down on some countries to see in which regions my impressions are loaded?
Why is my overall score not that bad when almost all my impressions are of low quality?
Why is there a discrepancy between the impression count in the Quality tab and the rest of the report while my campaign is running?
Will my viewability score of 0.0 affect the overall Quality score if I didn’t implement in-view tracking?
Reports
Customized PDF reports
Deeper Insights with Campaign Audience Measurement
Exporting your report
How to search for your project
Introducing the common affinity profile
Managing your projects with labels
Sample sizes
Tired of clicks and imps?
Understanding your project
Technical Questions
Account Administration
Ad blocking
Can I change the phone number I chose for the two-step verification process?
Checking SSL-Compliance
General Troubleshooting
Getting started with AudienceReport API
How do URL-parameters work?
How often will I be asked to log in through the two-step verification process?
How to track traffic by device type
If you accidentally delete pixels from your project
The procedure to enable the two-step verification
What if I lose my phone and cannot access my account?
Tracking Pixels
Upgrade to the new generation of AudienceReport
AudienceReport Upgrade FAQ
Comparing the original and the new generation of AudienceReport
How to import data from the original AudienceReport
UserReport
Installing UserReport and setting up your media sections
Defining your website in the media section
General Account Information
Installing UserReport on your website or app
Adding own user ID to UserReport
Configure Google Tag Manager to resolve media dynamically
Configuring media/section through snippet
Install UserReport script with Google Tag Manager
Installing UserReport SDK to Android Application
Installing UserReport SDK to iOS application
Installing UserReport script on your website
Kits
General Information
Reach and Coverage of Custom Segments
Target Audience verified by Kits
The technology behind Kits
What are Kits?
Getting started
Troubleshooting
Working with Kits
The feedback widget
Activate the Feedback widget
Adding context information to ideas and bugs
Customize Feedback widget buttons and links
Customize color, text and position of the Feedback widget
Disabling the Feedback widget on specific devices
Get direct link to the Feedback widget or manually display it
How to activate your Feedback widget
How to change the status of an idea or add a comment
How to disable the "report a bug" feature
Is the Feedback Forum available in my language?
Pre-populating username and email
What is the Feedback widget?
The feedback report
The survey widget
Activate Email Collect
Activate Net Promoter Score ®
Activate the Survey widget and create your questions
Chained questions and how they work
Controlling invitation frequency when using UserReport script and Google Tag Manager
How many questions can be added?
How many surveys answers do I need?
How to add questions to your survey
How to customise you survey widget
How to deactivate and delete your survey questions
How to show or hide results from users
Is UserReport 100% free?
Is the UserReport survey widget available in my language?
Managing invitation rules through Ad-server
Preview your survey
Respecting the user
User invitation to UserReport survey and the quarantine system
Who pays for the prizes in the survey?
Will UserReport slow down my website? Is it affected by popup blockers?
The Google Analytics Integration
The survey reports
Accessing Newsletter signups using API
- All Categories
- The original AudienceReport
- Reports
- Understanding your project
Understanding your project
Basic Actions
When you are in the report view, you can perform a series of actions. You'll find these in the top right corner of the report.
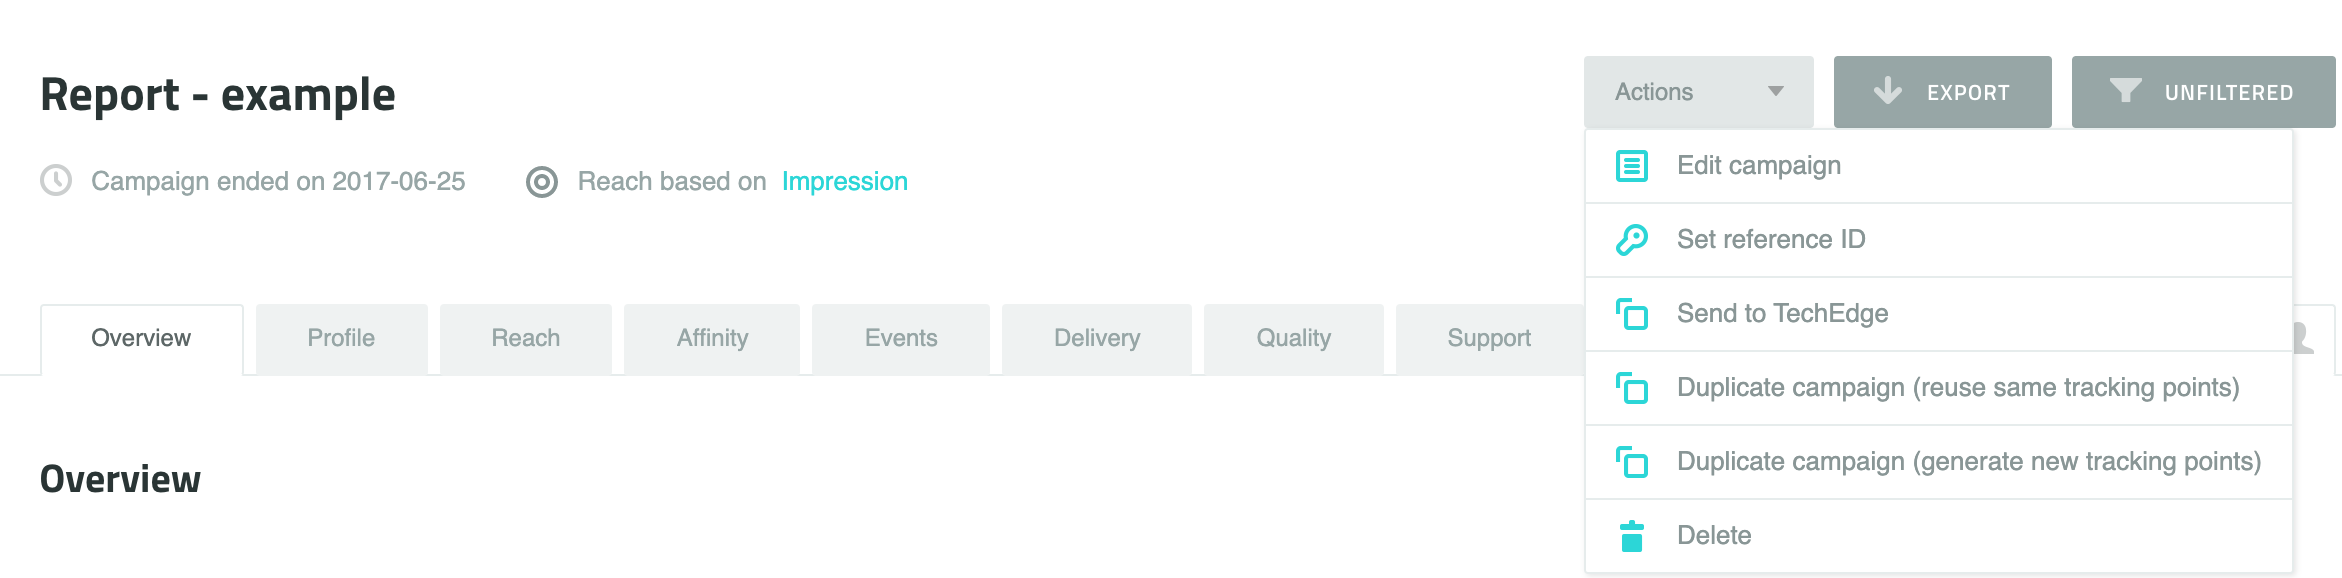
The "Actions" drop-down
Here you can edit, delete or duplicate your project and set a reference ID such as an order number or an ad server campaign ID.
The "Export" function
Here you can export your report. Choose between a nice, print-ready PDF, a raw Excel file and a beautiful PowerPoint Presentation.
The "Filter" function
Here you can hide certain parts of your project by filtering specific tracking points from the report. Read more
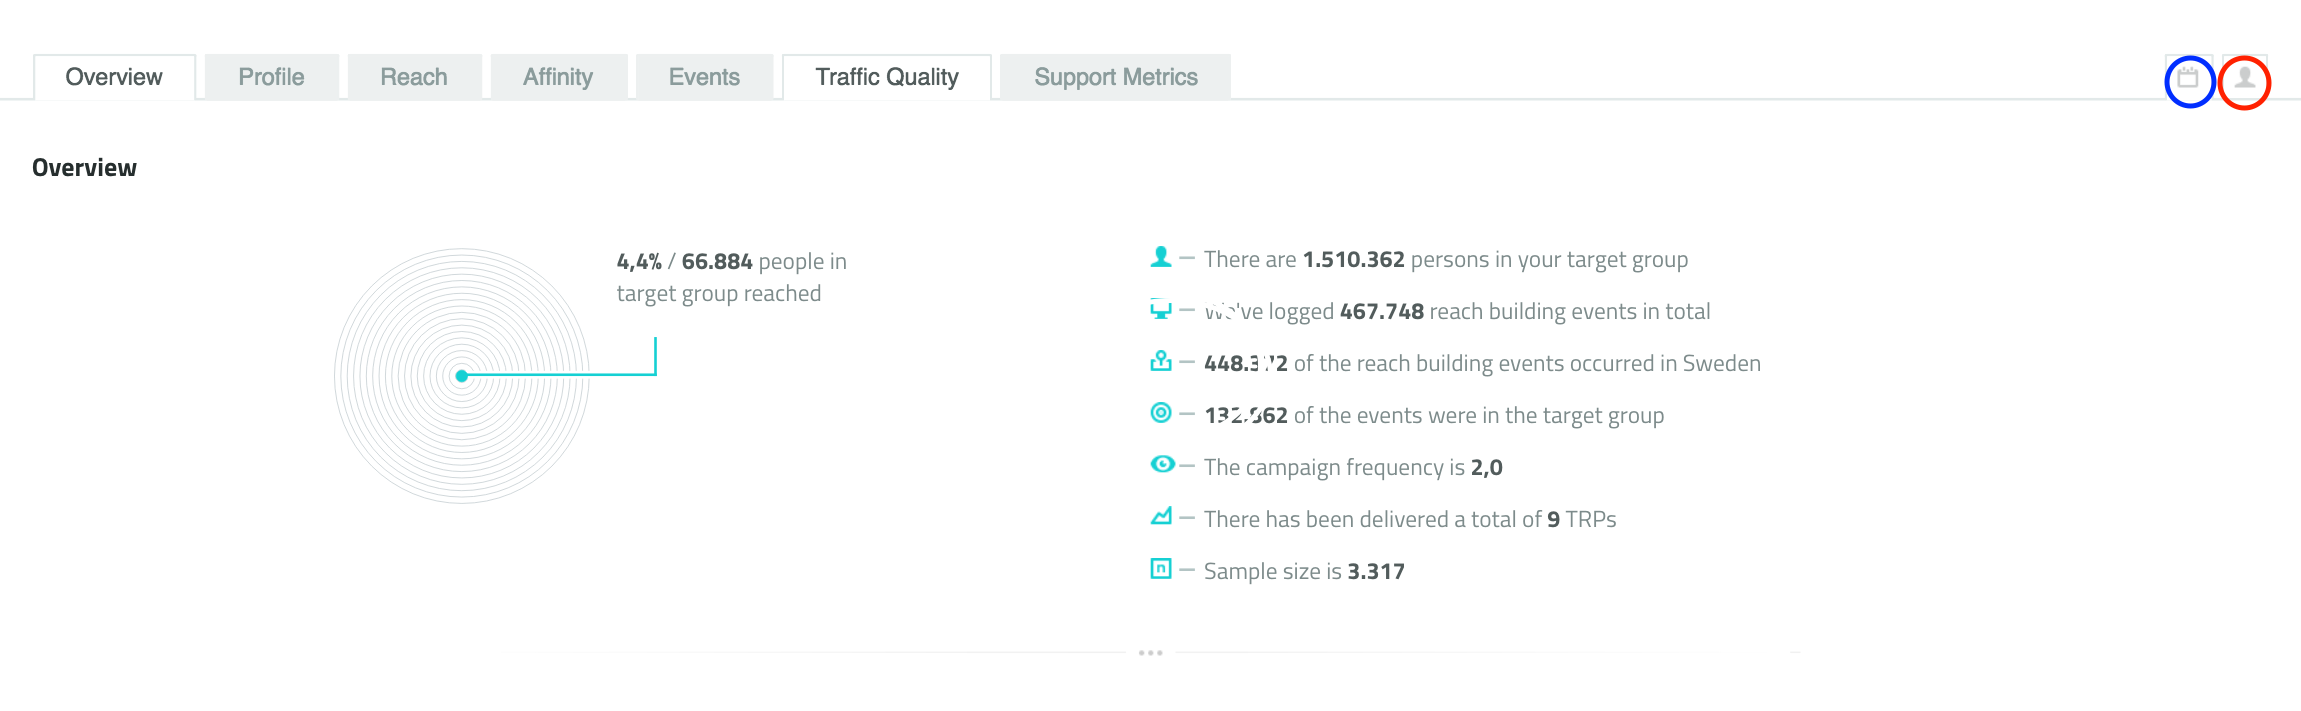
Shortcuts
In the top right corner - below the filter button - you can view and change your report period and project target group. Please feel free to read more on how to do this here.
The report tabs
Your report data are broken down into five different sections; “Overview”, “Profile”, “Reach” or "Coverage", “Affinity” and “Delivery”. These can be viewed by clicking the tabs under the project title. Below you'll find a brief explanation of each tab.
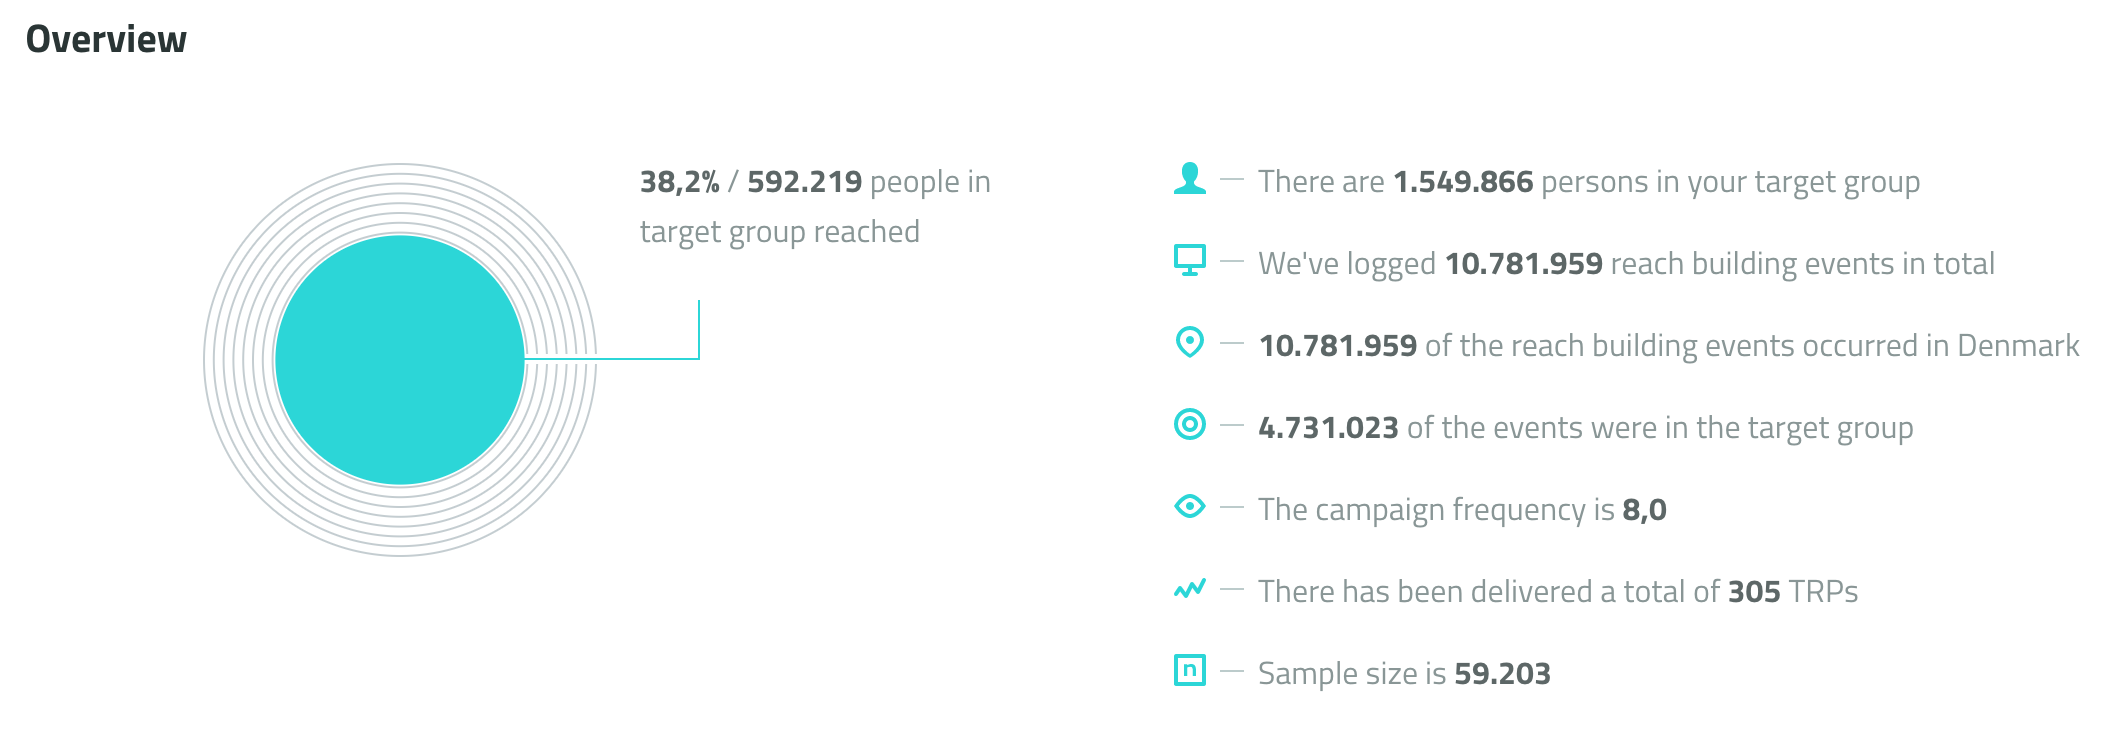
OVERVIEW
This tab consists of three different elements; “Overview”, “Total impression buildup” and “Impression details”.
This provides you with a quick overview of a list of project key numbers. The key numbers include:
- Target group reach: The percentage and number of people reached in the target group.
- Target group: The chosen target group size in the online population.
- Total impressions: The number of total impressions delivered by the project.
- Impressions: The number of total impressions that actually reached the defined target group.
- Campaign frequency: The frequency of the campaign is based on the sample size. INFO: The campaign frequency is the actual number of times panellists in the sample size were exposed to the campaign. The average frequency in the overview, therefore, doesn't change when changing the Target Group.
- TRP: The number of TRPs delivered by the project. INFO: TRP is short for "target rating point". It is an expression of the stimuli in a specific target group. The stimuli are measured by the number of people reached in the target group in relation to the overall number of people in the target group and the average frequency of impressions per person. Therefore, the TRP is given by multiplying the percentage of people reached in the target group within each specific tracking pixel with the frequency of impressions per person. The TRPs from each tracking pixel are rounded up and then accumulated, which might be why the TRP you see in AudienceReport is slightly different than if you try to calculate it from the numbers in the overview. To calculate TRP you will need the numbers from the "Reach" tab, under "Reach details".
TRP = (ReachP1 * FrequencyP1) + (ReachP2 * FrequencyP2)+ ...+(ReachPN * FrequencyPN),
where P= placement and N=total number of placements.
TRP = 10,8 *5,4 + 9*5,2 + 1,4*21,2 + 1,2 * 8 + 0*5,9 +7,2 *3,8 = 58,32 + 46,8 +29,68 +9,6 + 0 + 27,36
Round up to: TRP = 58 + 47 + 30 + 10 + 0 + 27 = 172
- Sample size: The sample size (n) shows the number of recognized persons. Read more about sample size here.
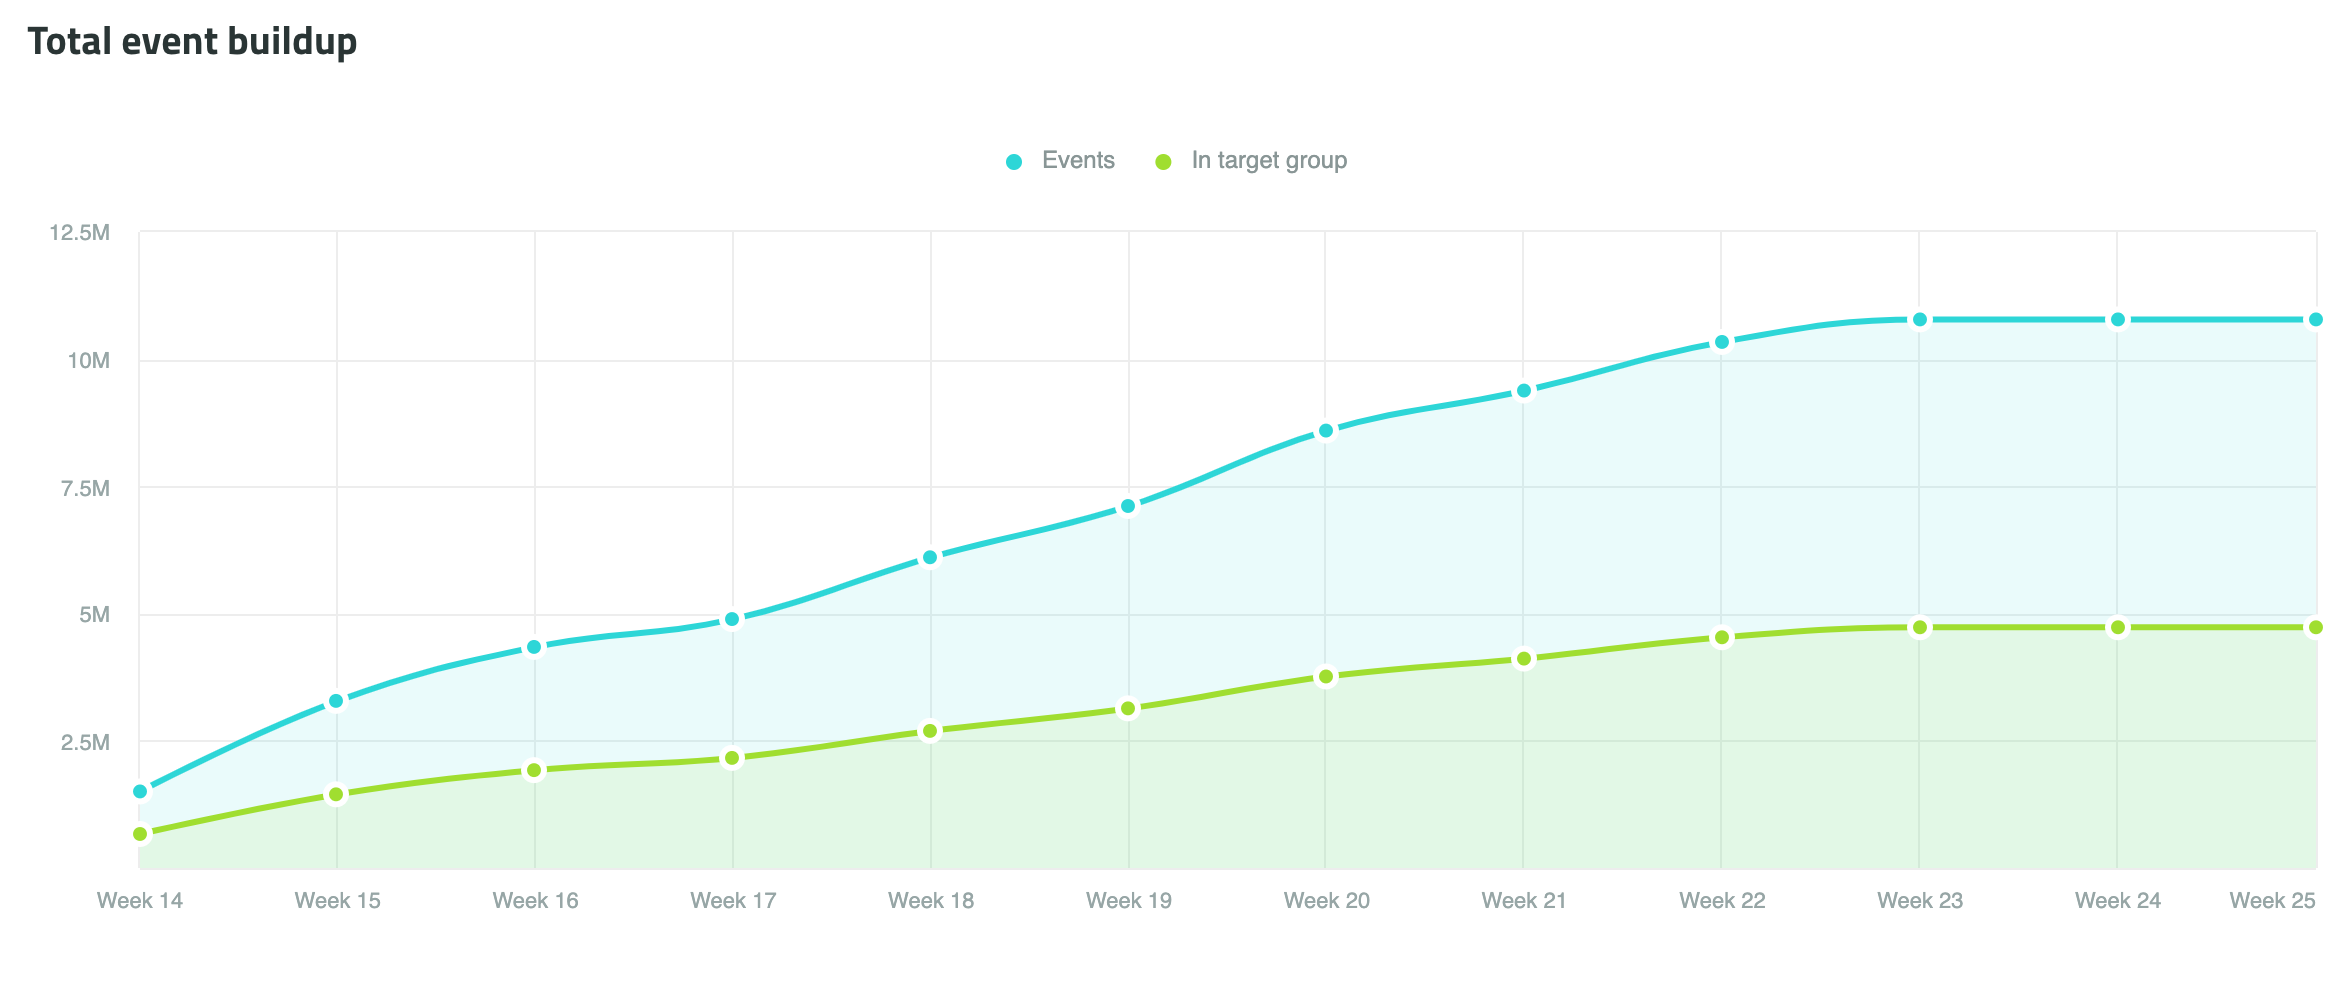
Total impression buildup
This shows you a graph of the development of impressions in the reporting period. The graph is divided into total impressions and impressions in the target group. When moving your marker over the graph, you will see the number of total impressions, impressions in the target group and the weekly increase of impressions for each individual week.
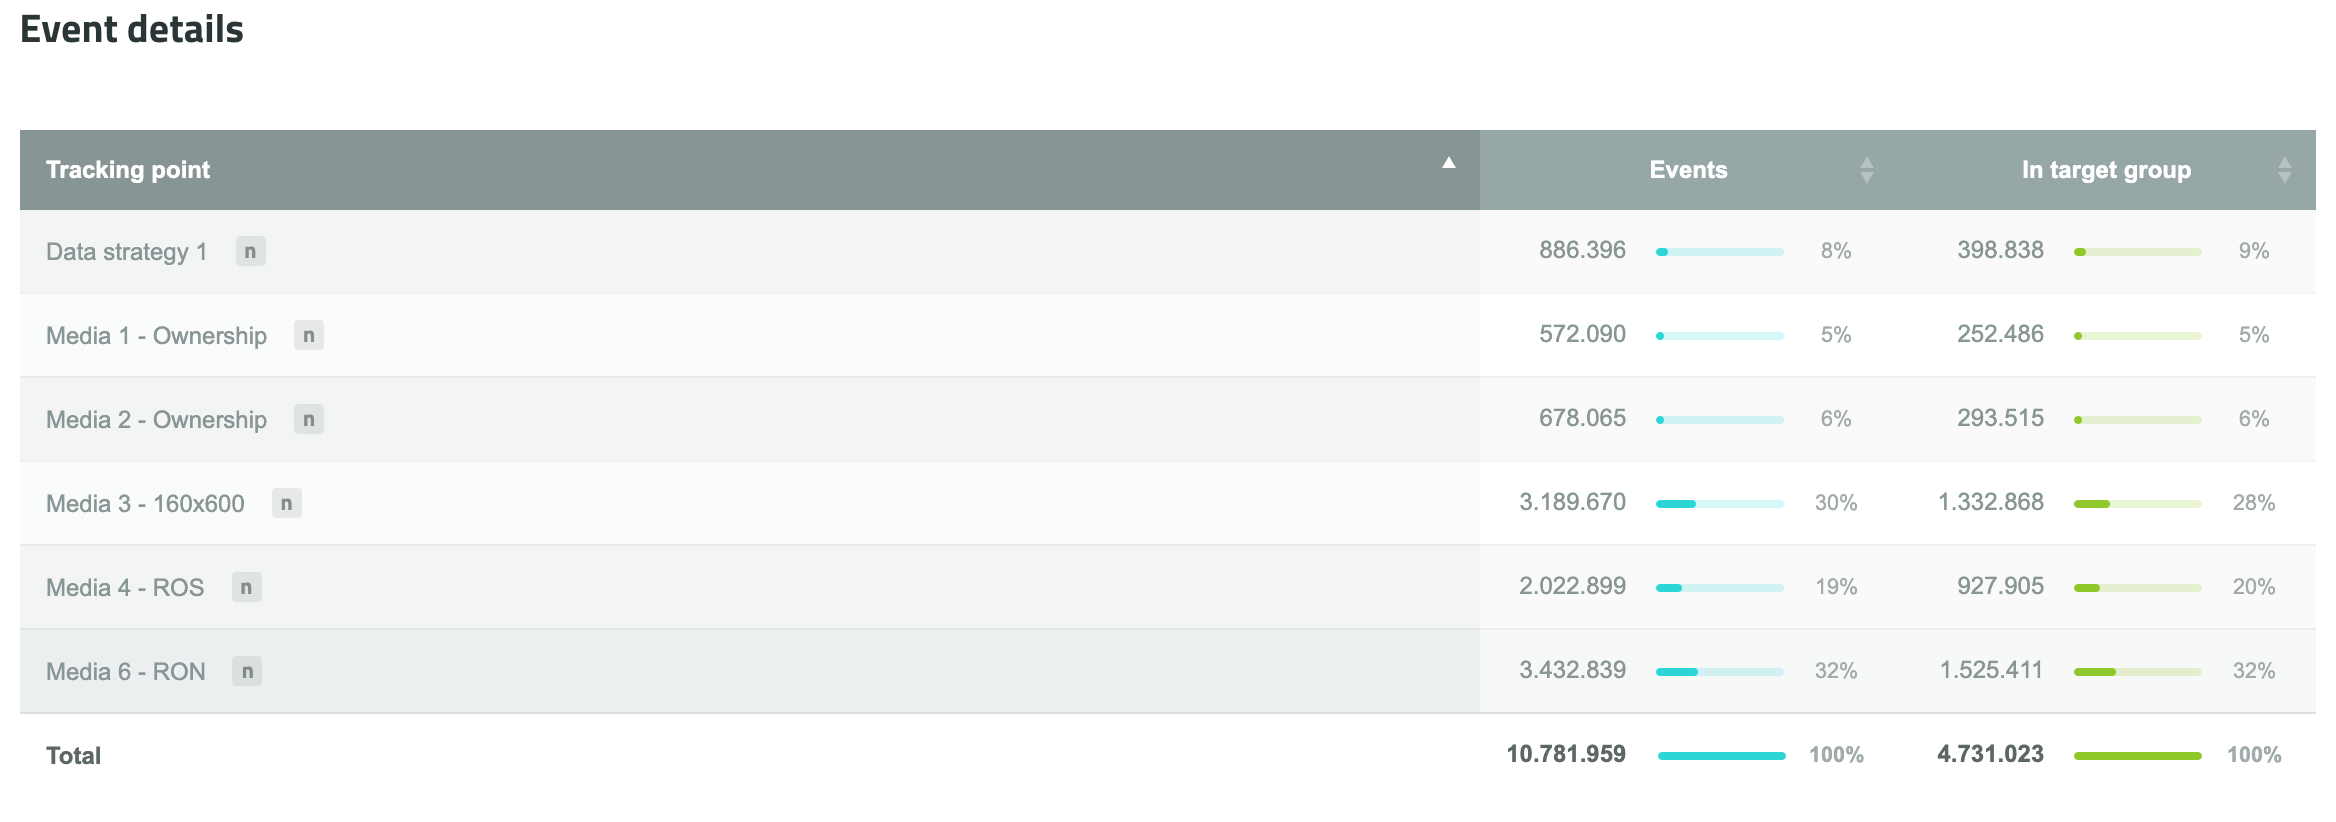
Impression details
This gives you an overview of each of your tracking points and their number of impressions. Again, the number of impressions are divided into total impressions and impressions in the target group. When moving your marker over the “n” button to the right of the tracking point, you will see the sample size for this specific tracking point.
PROFILE
The profile tab consists of two different elements; "Common affinity profile" and "Profile details".
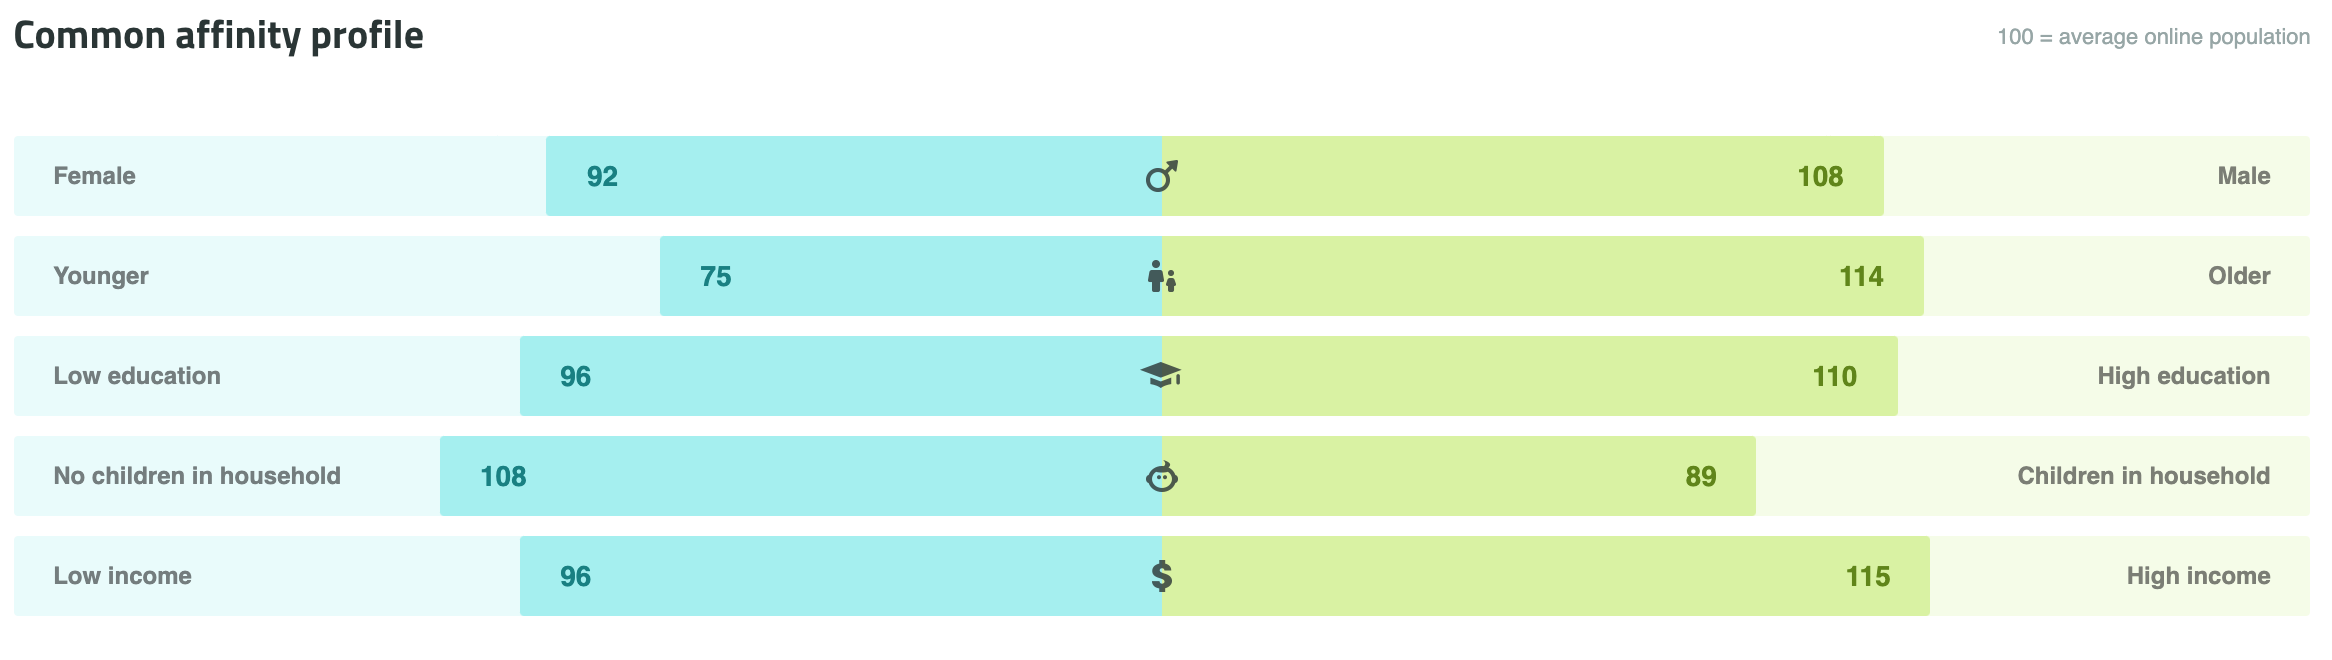
Common affinity profile
This provides you with a quick overview of the campaign's audience. It measures the campaign's audience relative to the online population, based on five demographic variables; gender, age, income, education and household, where the average online population is set to 100. Read more
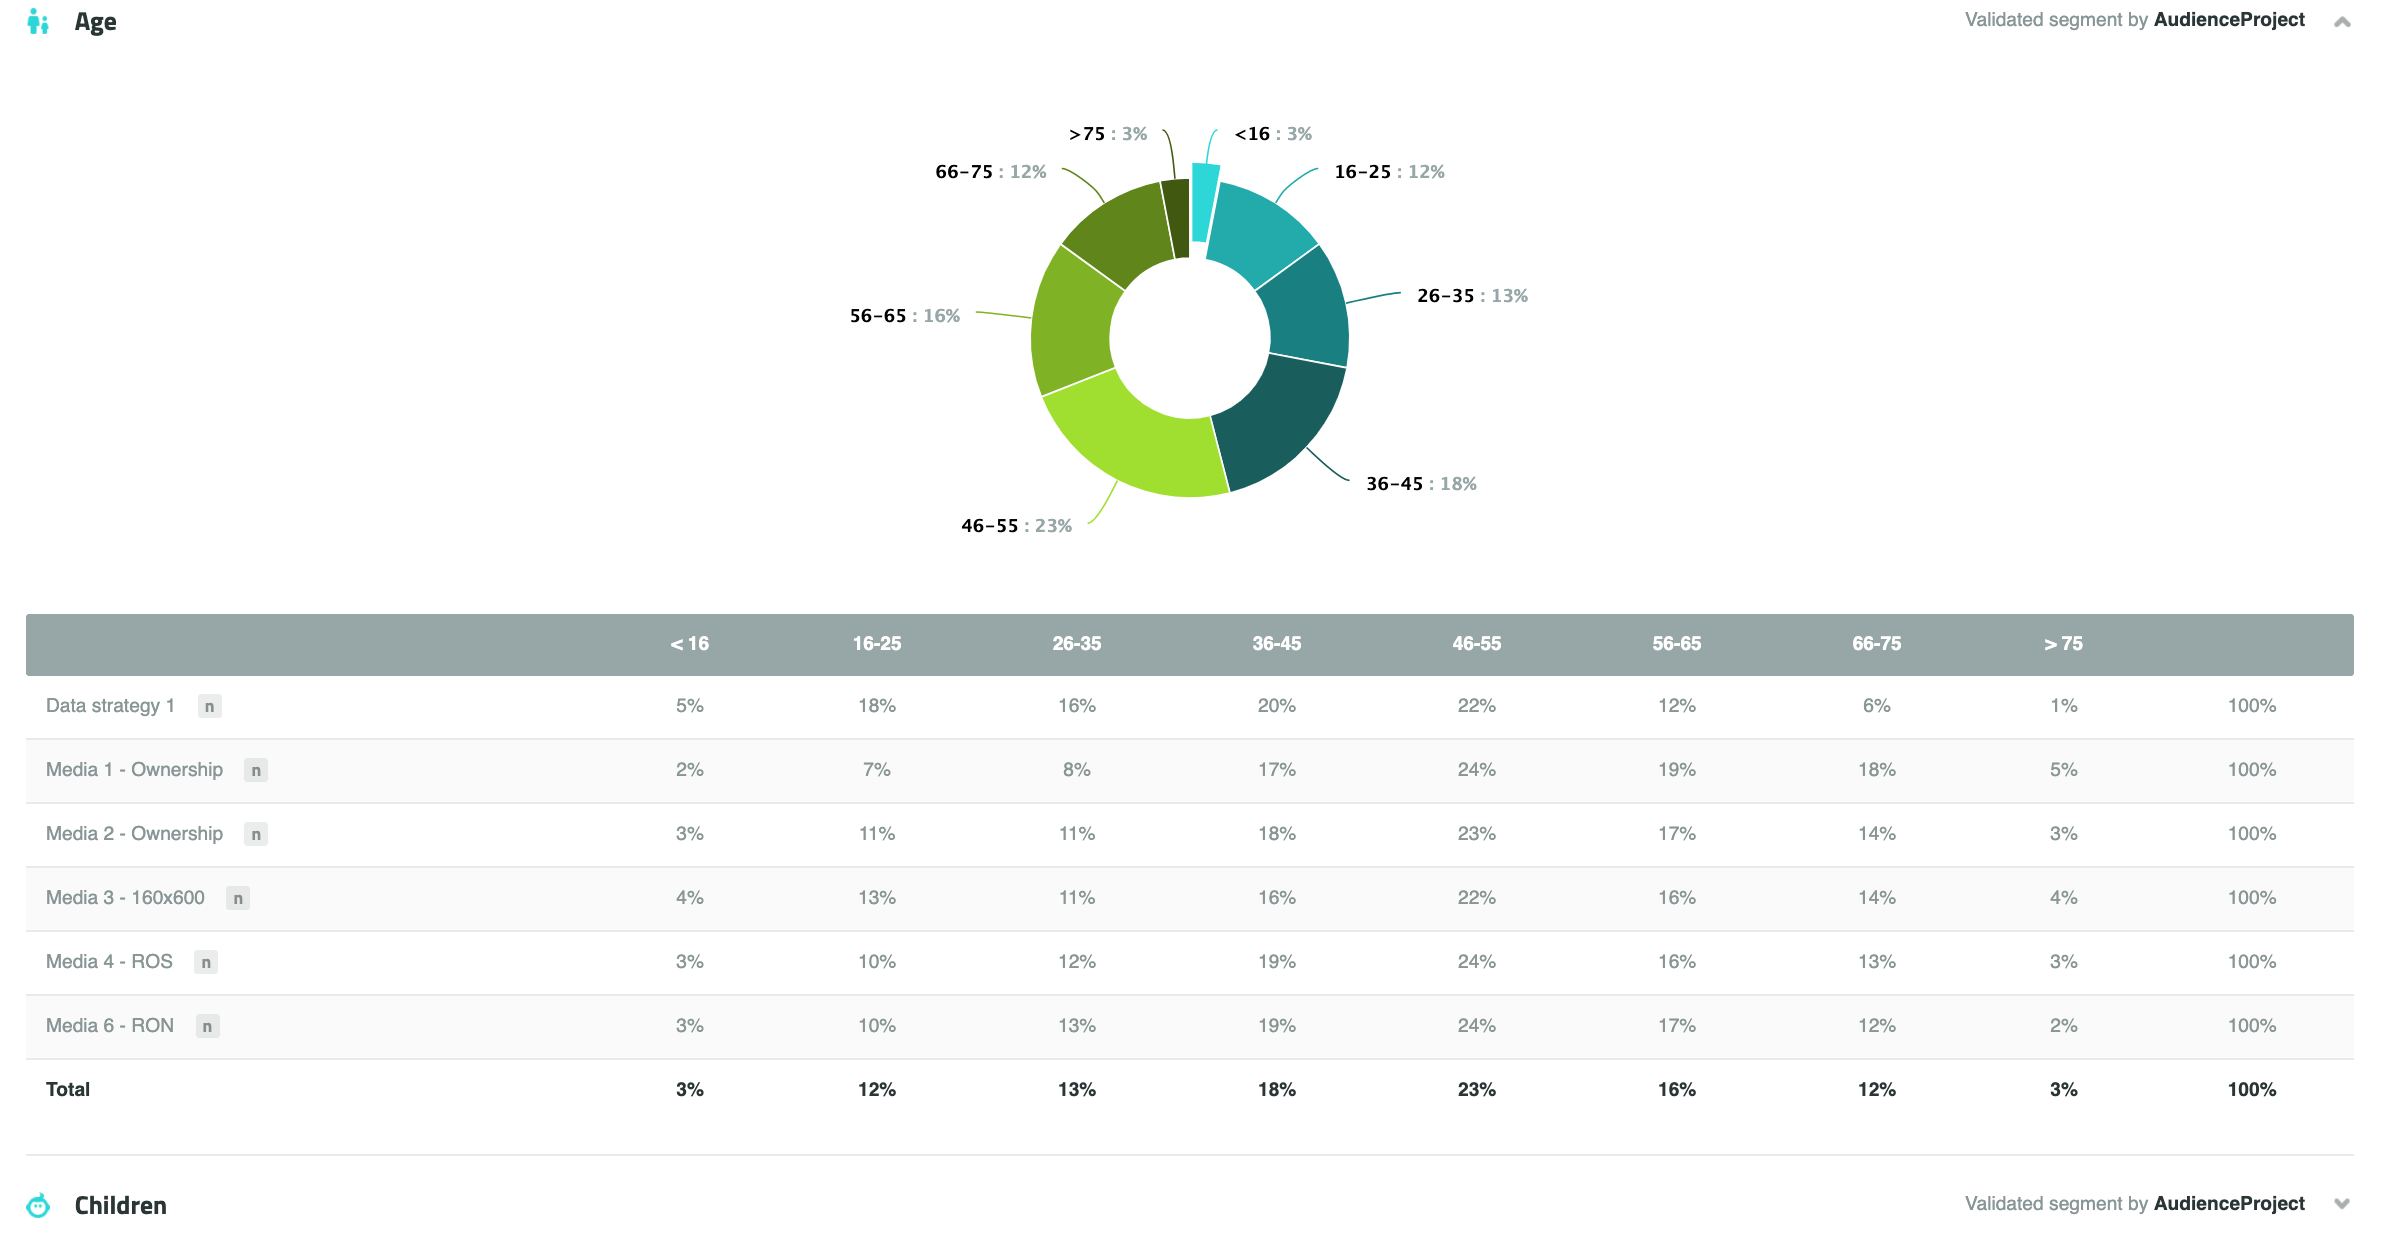
Profile details
This shows you the proportion of your created tracking points in relation to both seven demographic variables (age, children, education, employment, gender, household size and income) and/or to the custom segments you have selected for your campaigns like purchase intents and ownerships ones. Read more about Custom Segments here.
REACH
The reach tab consists of two different elements; "Reach buildup" and "Reach details".
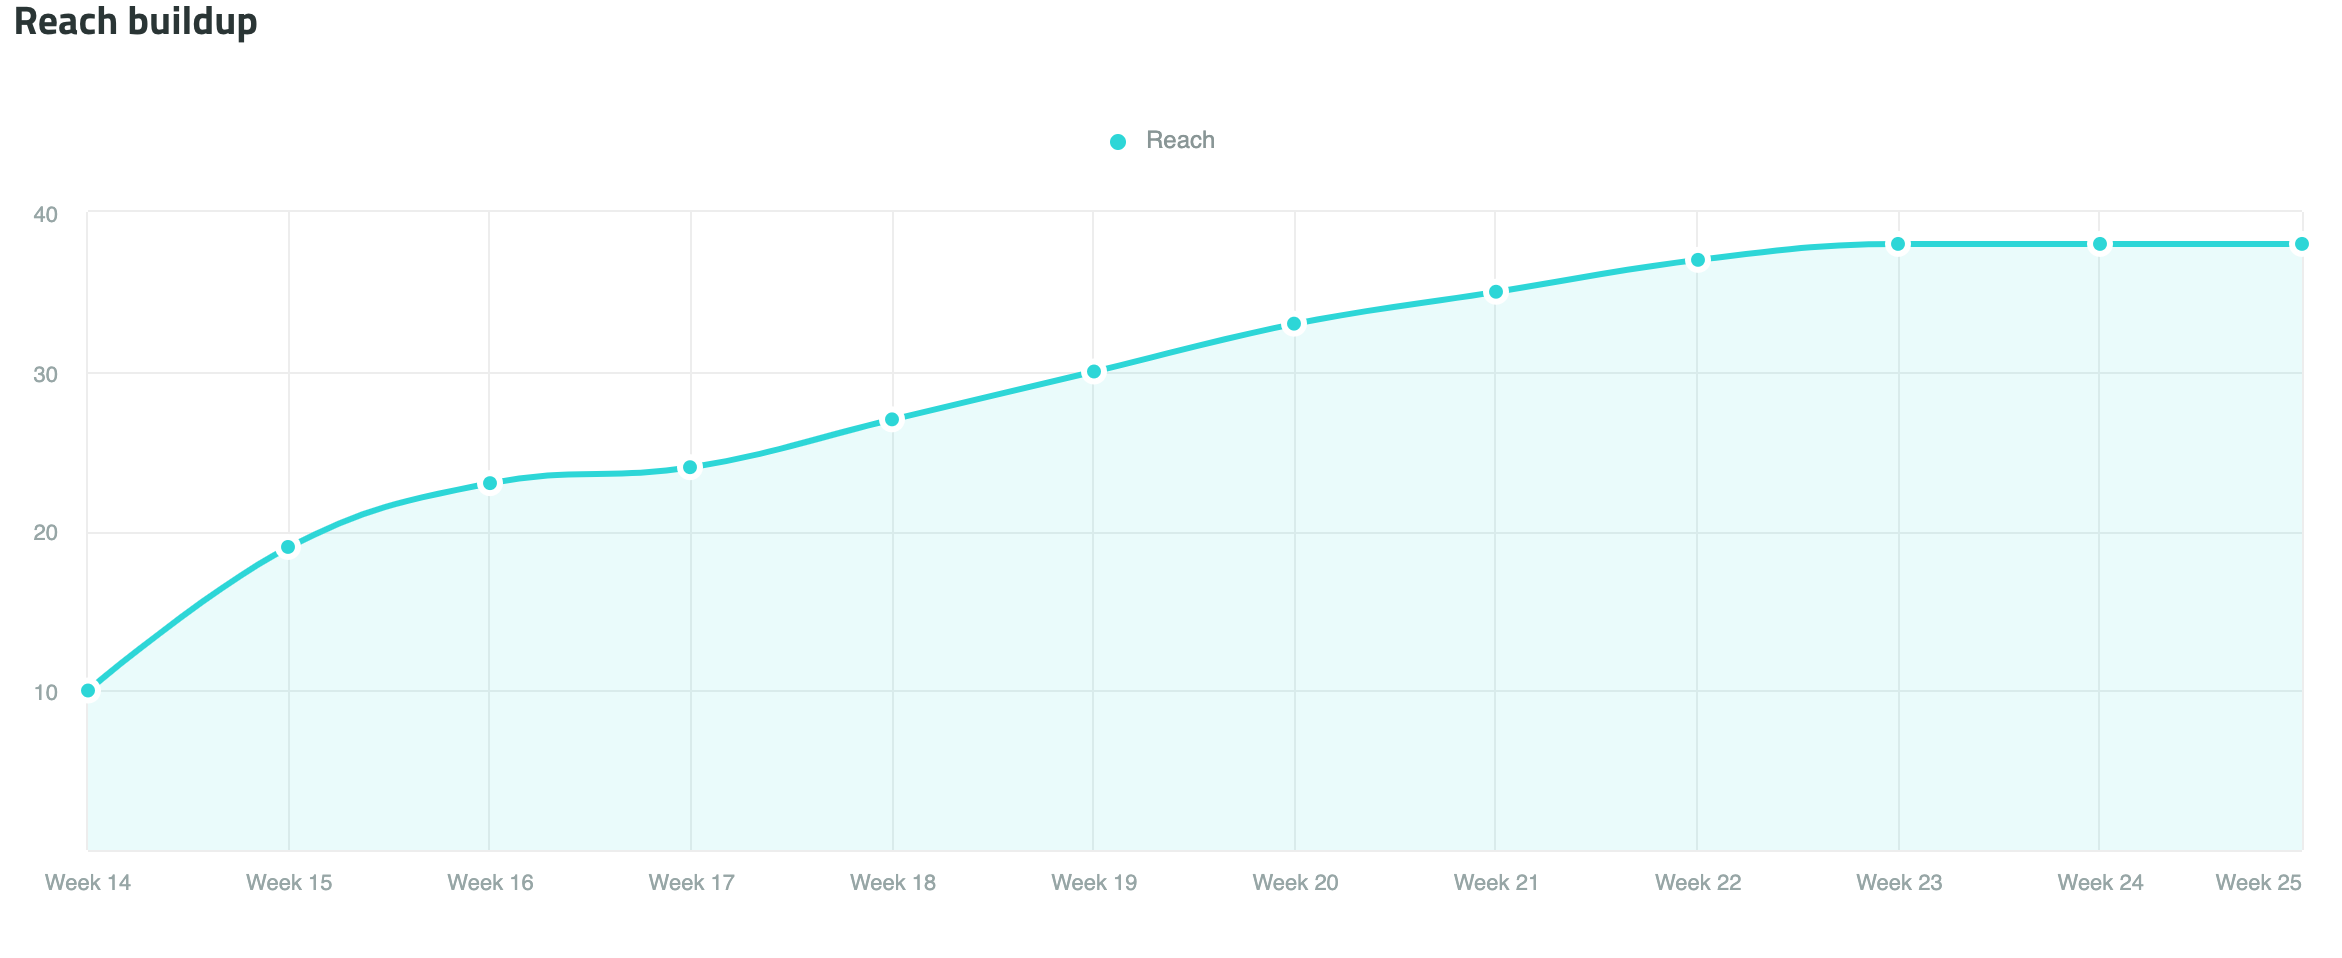
Reach buildup
This shows you a graph of the development of people reached in your target group in the reporting period. When moving your marker over the graph, you will see the percentage of people reached in your target group, the number of TRPs and the incremental reach for each individual week.
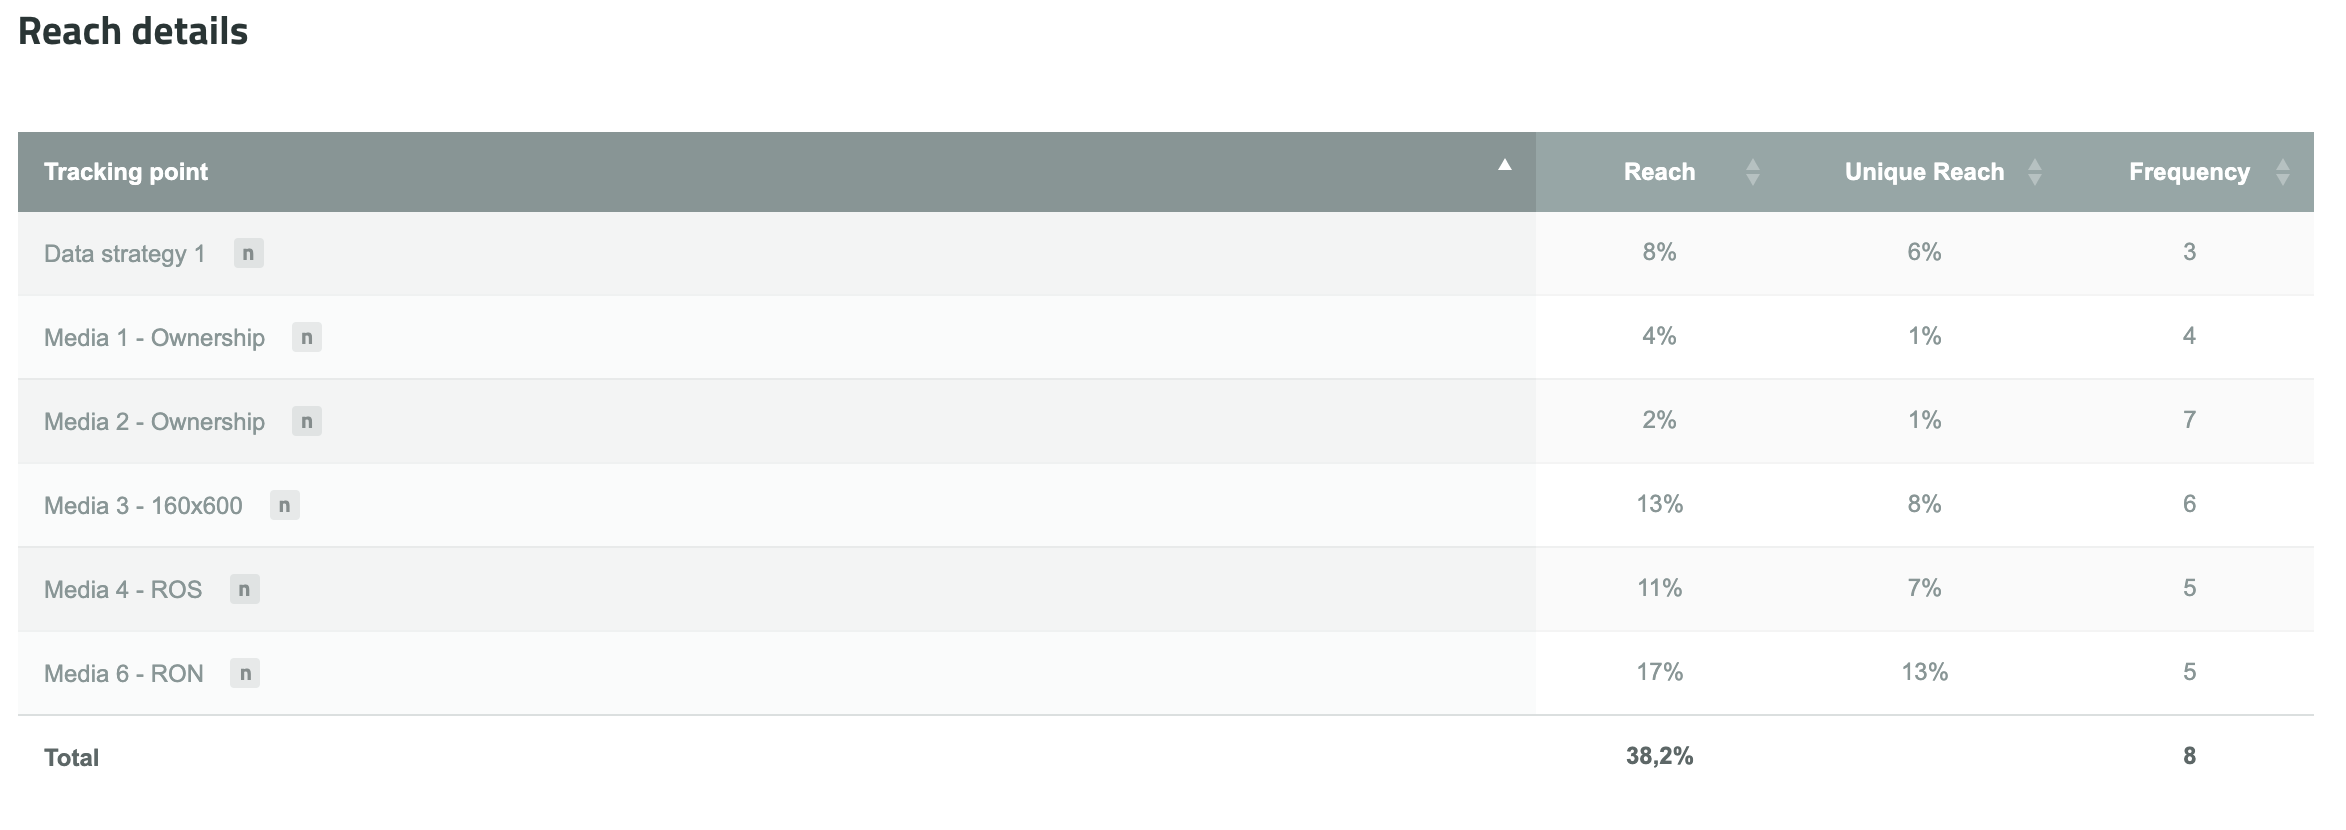
Reach details
This gives you an overview of each of your tracking points and their reach, unique reach and frequency. The unique reach indicates the reach of the specific media and takes possible double coverage into account - a person can be exposed on more than one placement. When moving your marker over the “n” button to the right of the tracking point, you will see the sample size for this specific tracking point. This is also where you find the numbers to calculate TRP.
COVERAGE
When you are adding custom segments to your campaigns, keep in mind that reach will be reported as coverage. This is because the validation of your campaigns, in this case, is based on unverified 3rd party data and not on numbers from statistical banks. To read more about this check our guide.
The Coverage section outlook is the same as the Reach one and has the same features and functionalities. This section, just like the Reach one, is divided into Coverage buildup and Coverage details.
AFFINITY
The affinity tab consists of two different elements; “Best performing tracking points” and “Affinity details”.
Affinity is defined by the share of impressions in target group relative to the target group share of the online population. A share of impressions in target group corresponding to the target group share of the online population is set to affinity 100. A value over affinity 100 indicates that there is a higher share of impressions in the target group than the target group share of the online population represents and vice versa.
It can be calculated through the following formula:
Affinity= (Share of unique impressions in the target group) / (Target group share of the online population) * 100
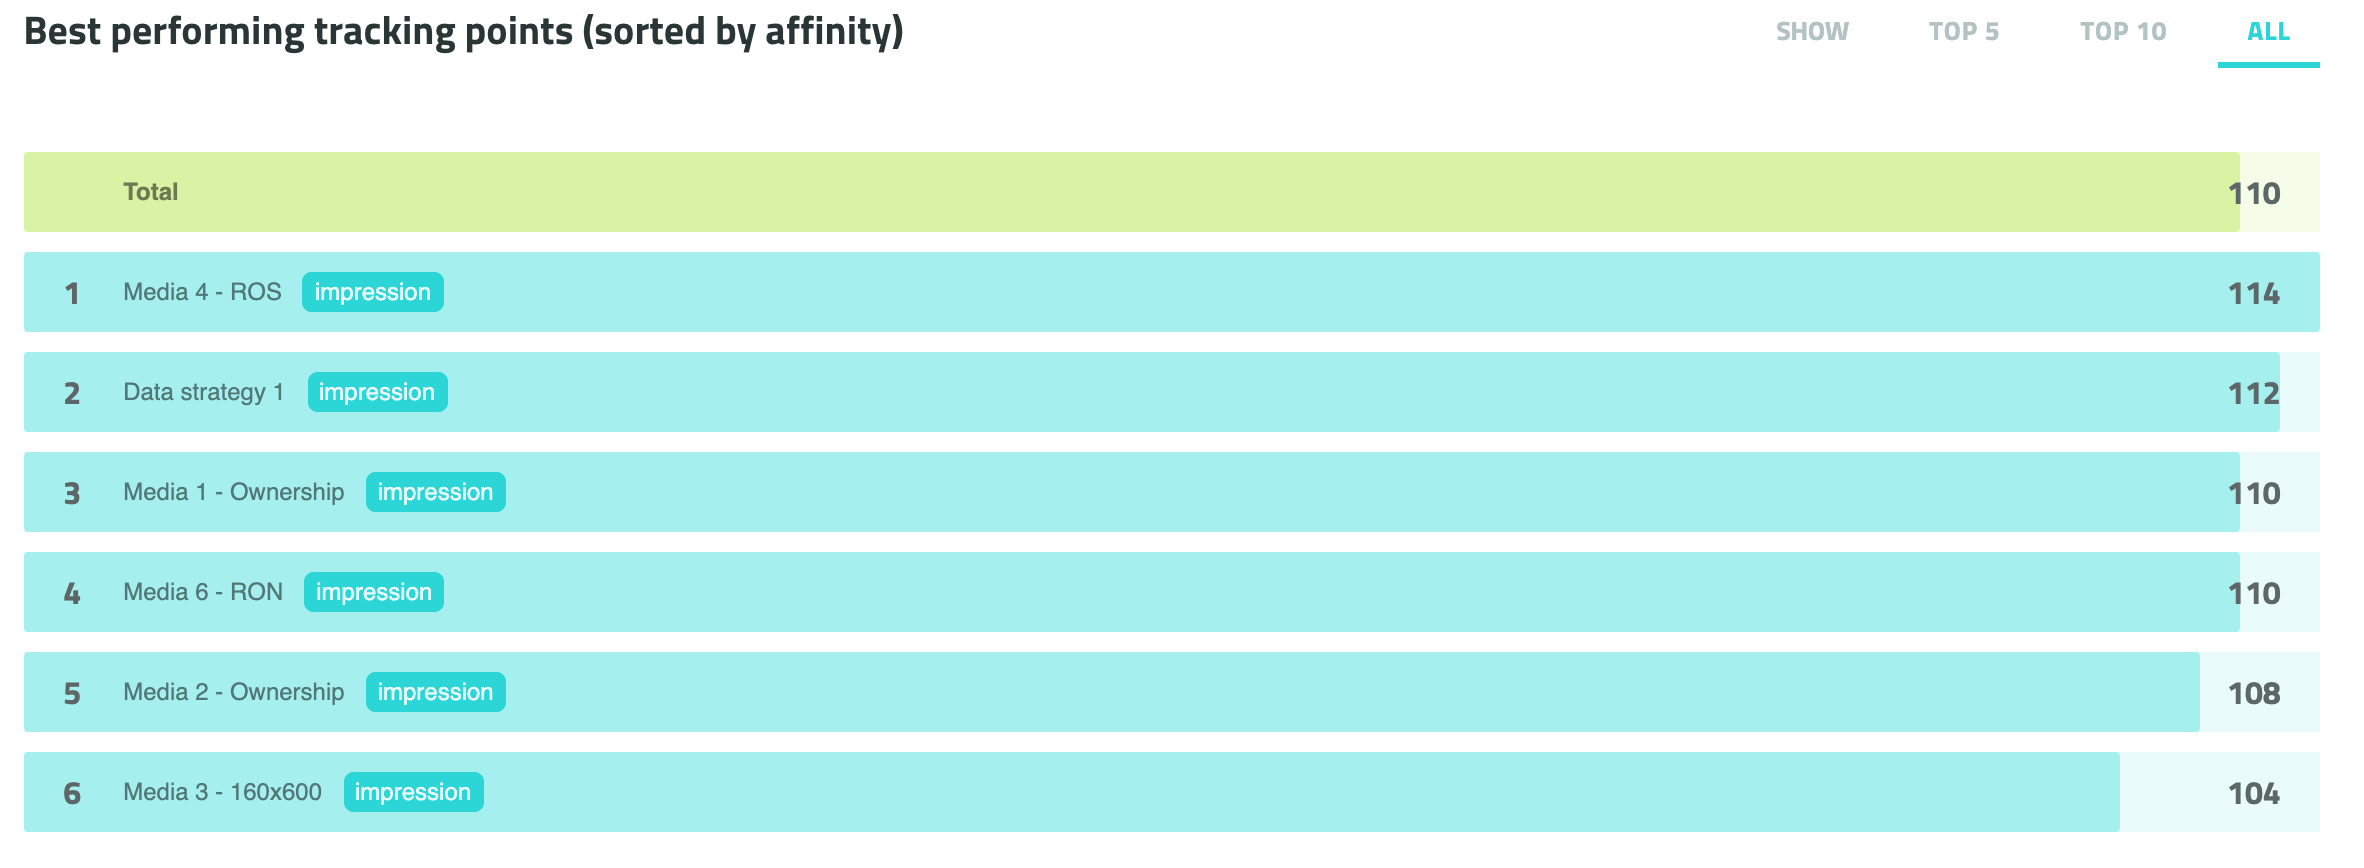
Best performing tracking points
This gives you an overview of the performance of each of your tracking points in your campaign. Here, the affinity is an index of how well you are at reaching your selected target group on your campaign, in total and for each specific placement/media. The total affinity is made up by the weighted average of all the campaign tracking pixels.
If a target group for your campaign is not defined, the affinity for all media will be 100. This is due to the fact that by not defining a target group, you automatically target the entire online population.
If you have a lot of tracking points, you can choose to just show the top 5 or top 10 tracking points in your affinity list in the report.
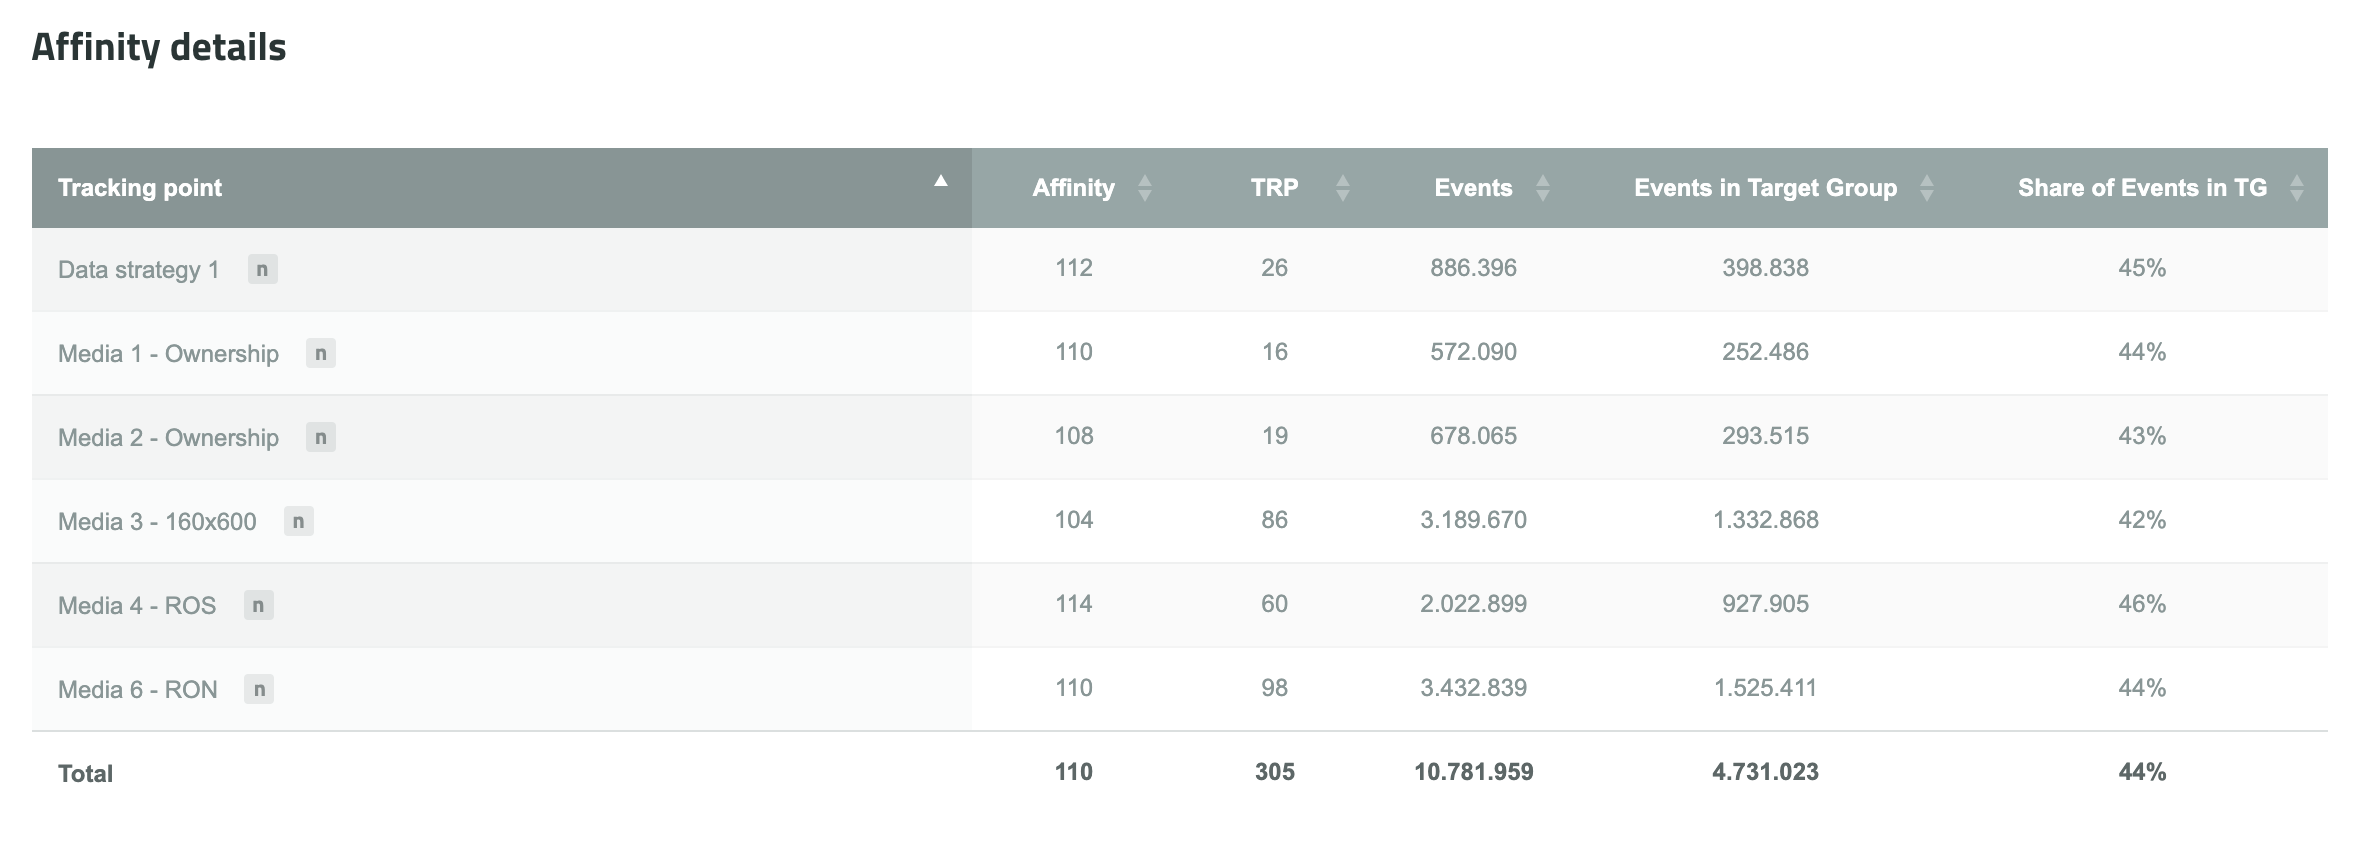
Affinity details
This gives you an overview of each of your tracking points and their share of impressions in the target group, which the affinity is based upon. Also, it provides you with the number of TRPs delivered by each of your tracking points. When moving your marker over the “n” button to the right of the tracking point, you will see the sample size for this specific tracking point.
DELIVERY
In this tab, you can choose to get data on delivery for the whole project or each of the individual tracking points.
When getting data for the whole project, the tab consists of four different elements; “Daily impressions”, “Hourly impressions” and “Device type ratio”. When getting data for a specific tracking point, an extra element is added; “Cachebuster ratio”.
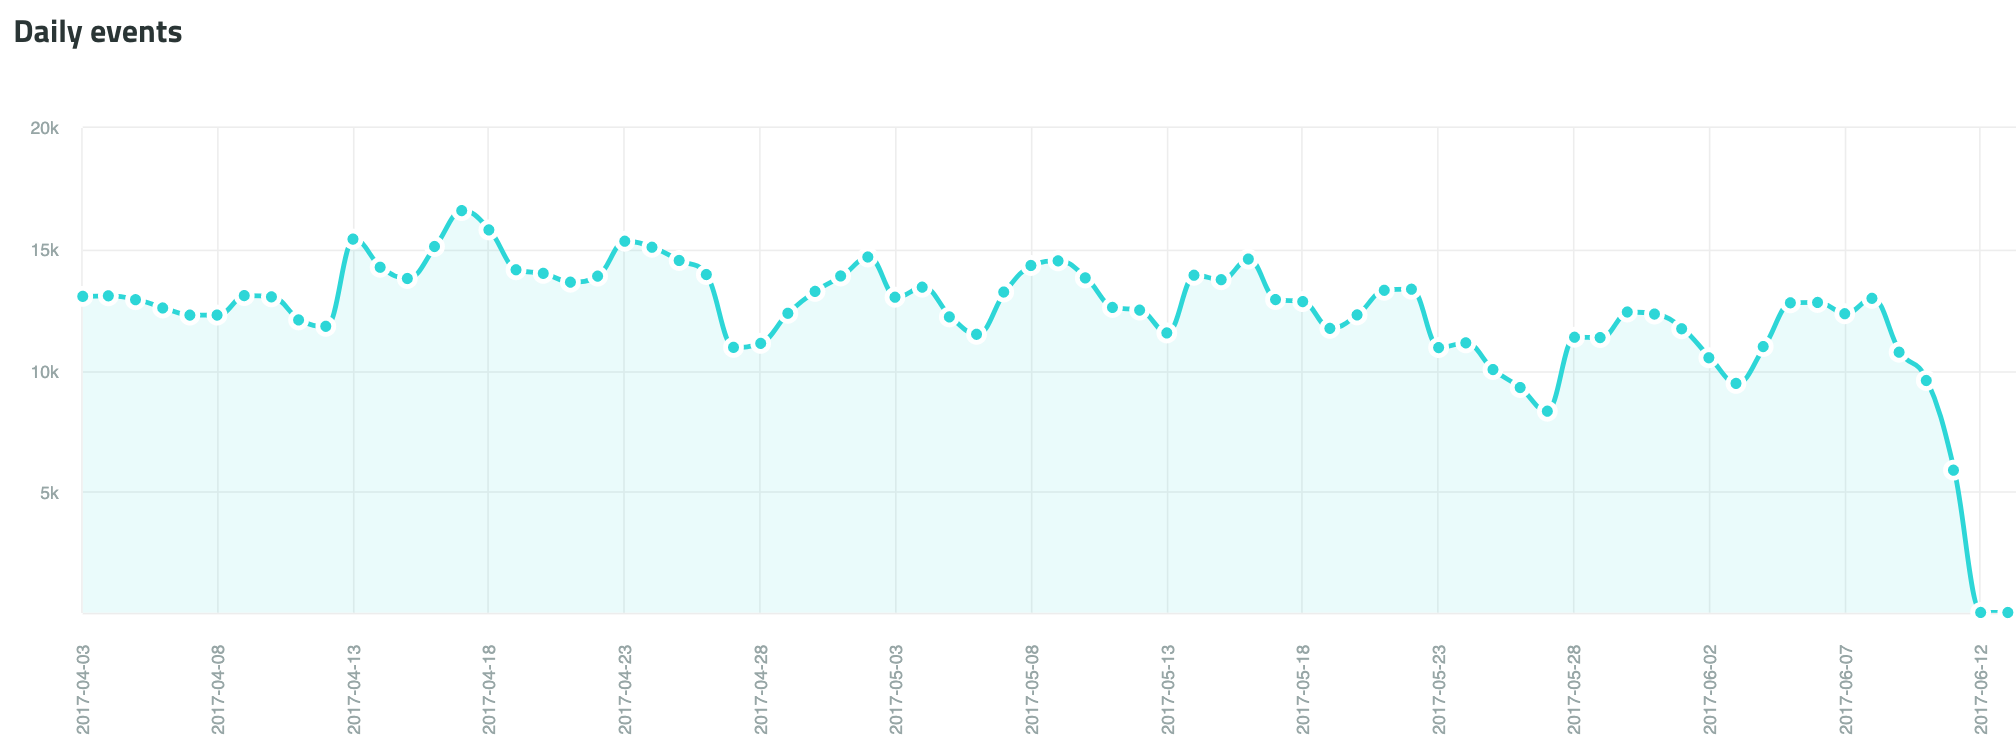
Daily impressions
This gives you an overview of the development of daily impressions in your report period. When moving your marker over the graph, you will see the number of impressions for each day.
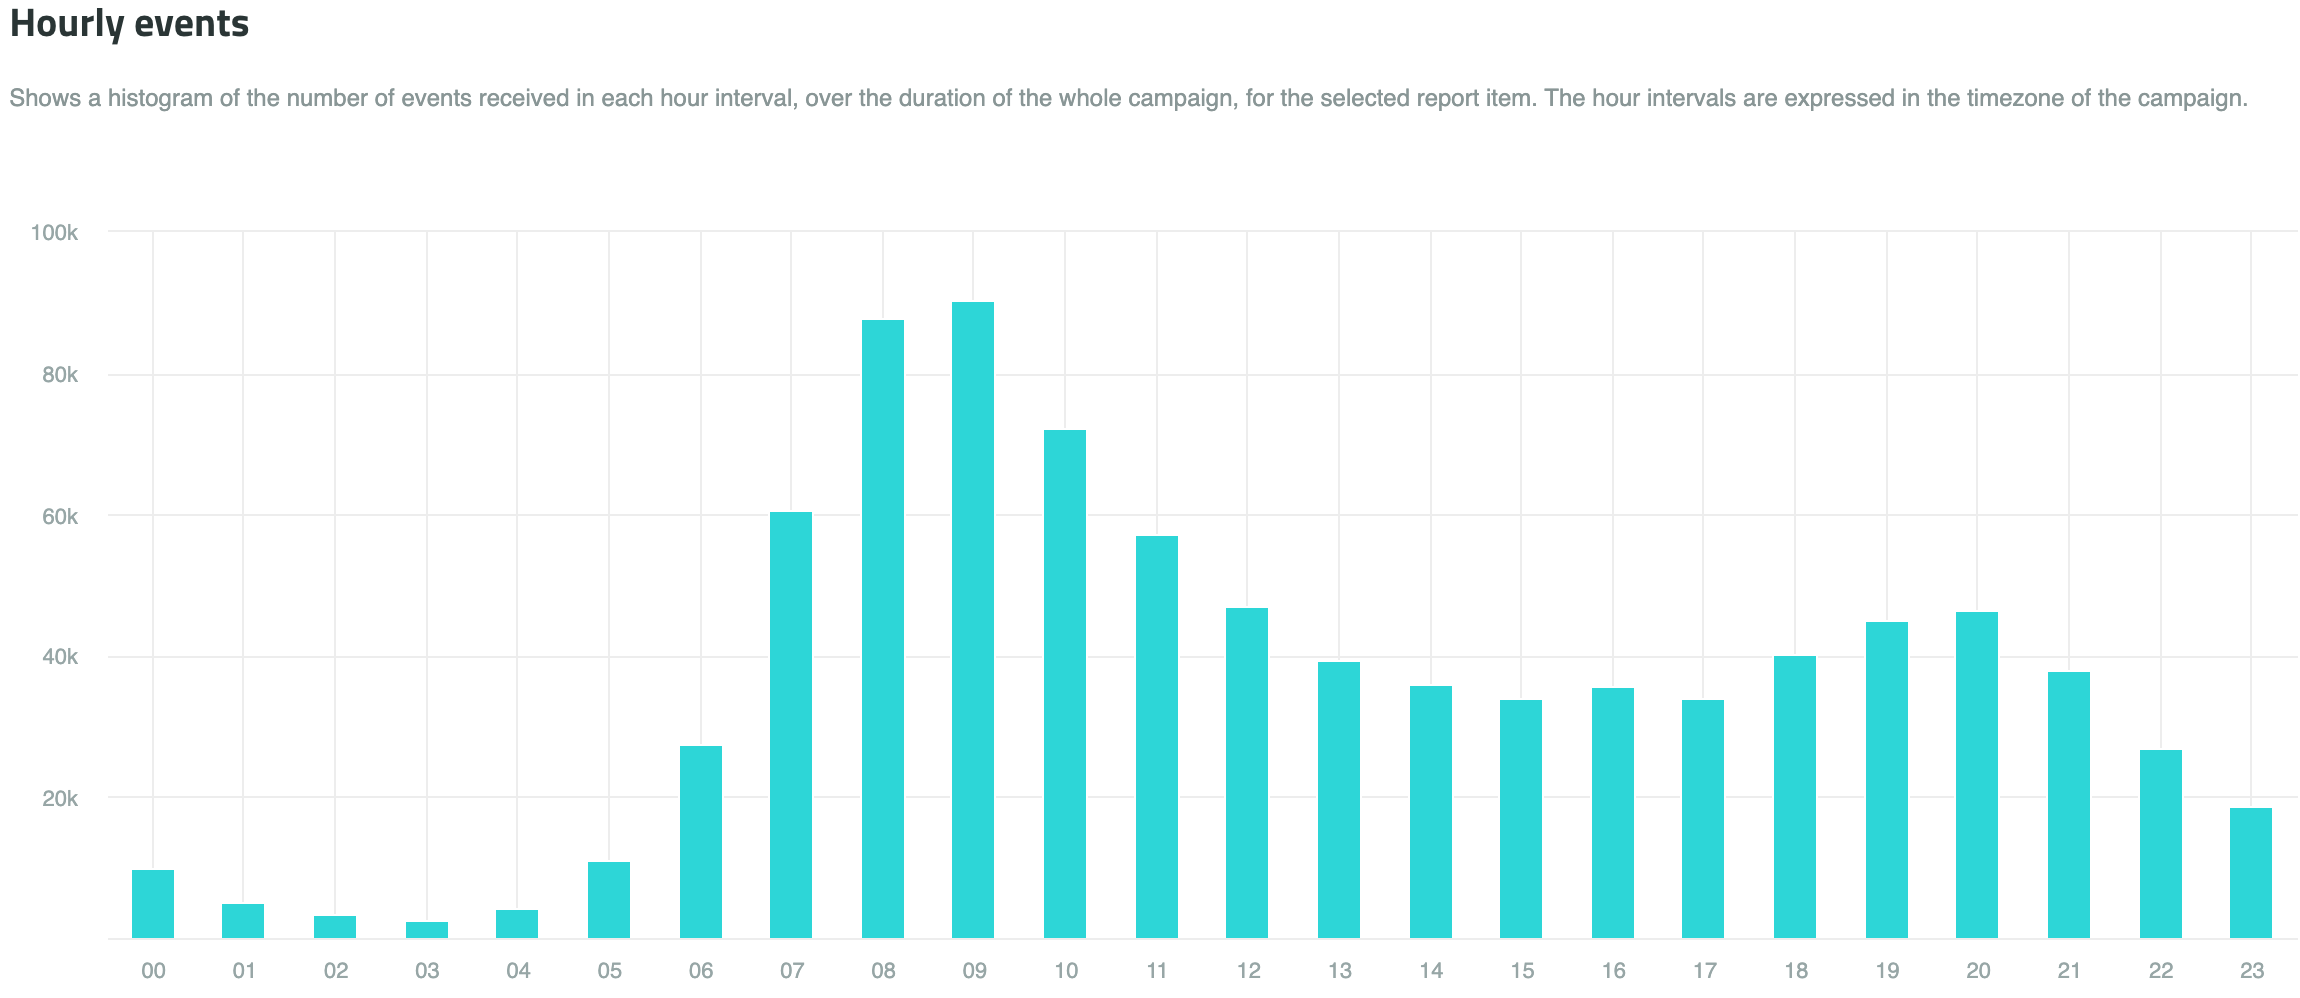
Hourly impressions
This shows you a histogram of the number of impressions received in each hour interval. The hour intervals are expressed in the time zone of the campaign. When moving your marker over the histogram, you will see the number of impressions for each hour interval.
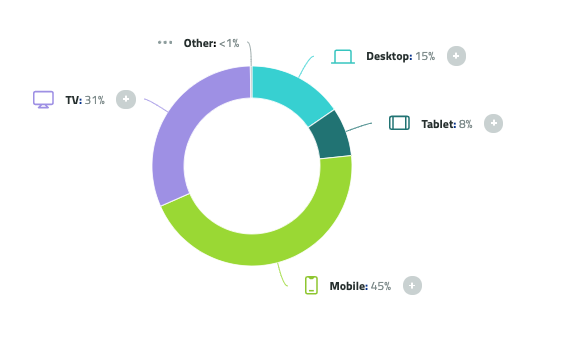
Device type ratio
This gives you an overview of the distribution of impressions across different devices; desktop, mobile, tablet and other devices.
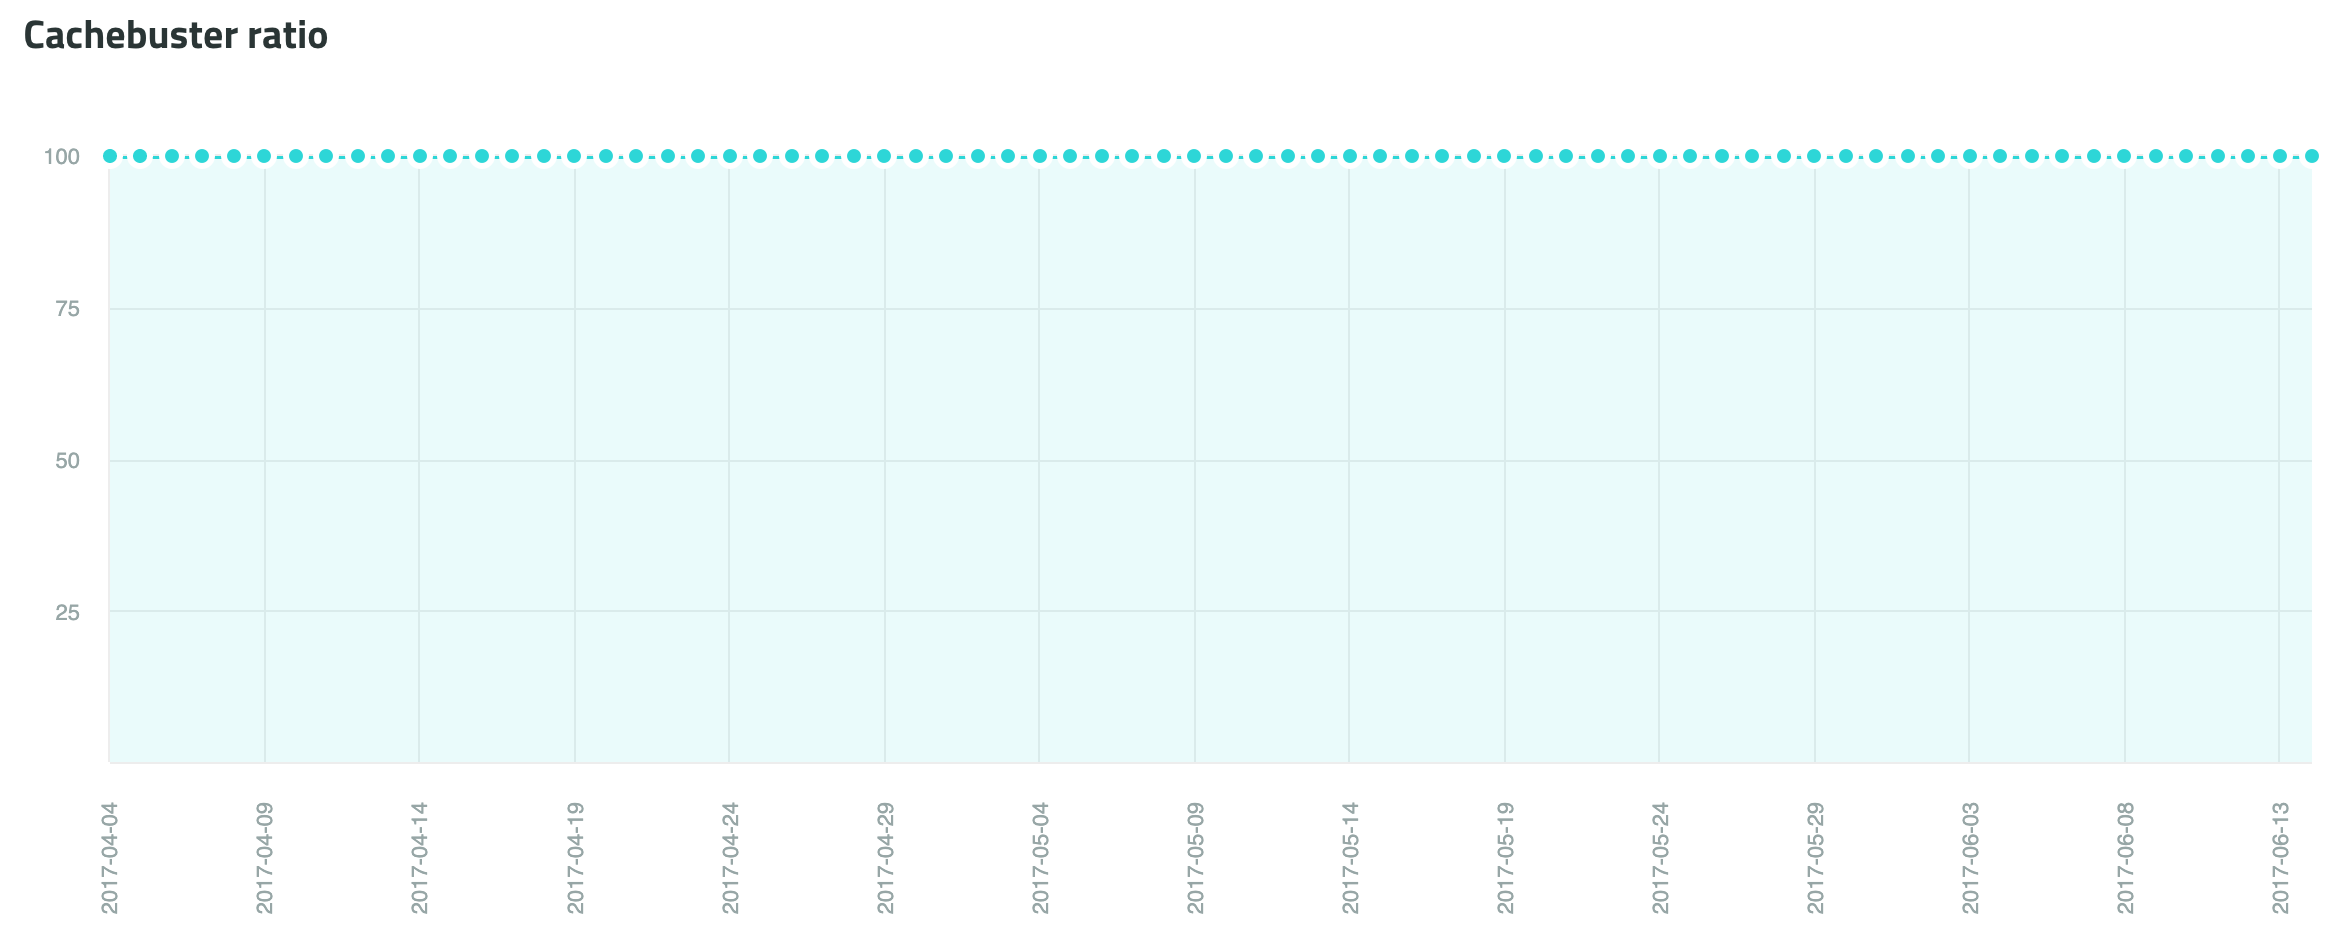
Cachebuster ratio
This shows you the cachebuster ratio on the selected tracking point during the report period. In other words, the graph tells you if the specific tracking point has got a cachebuster during the entire campaign or not.
EVENT TAB
The event tab will allow you to get an overview of the performance of the different events in your project. I.e. how many that has clicked from after generating an impression.
The Event tab, consist of three elements; Event funnel, Event funnel details and Even timeline.
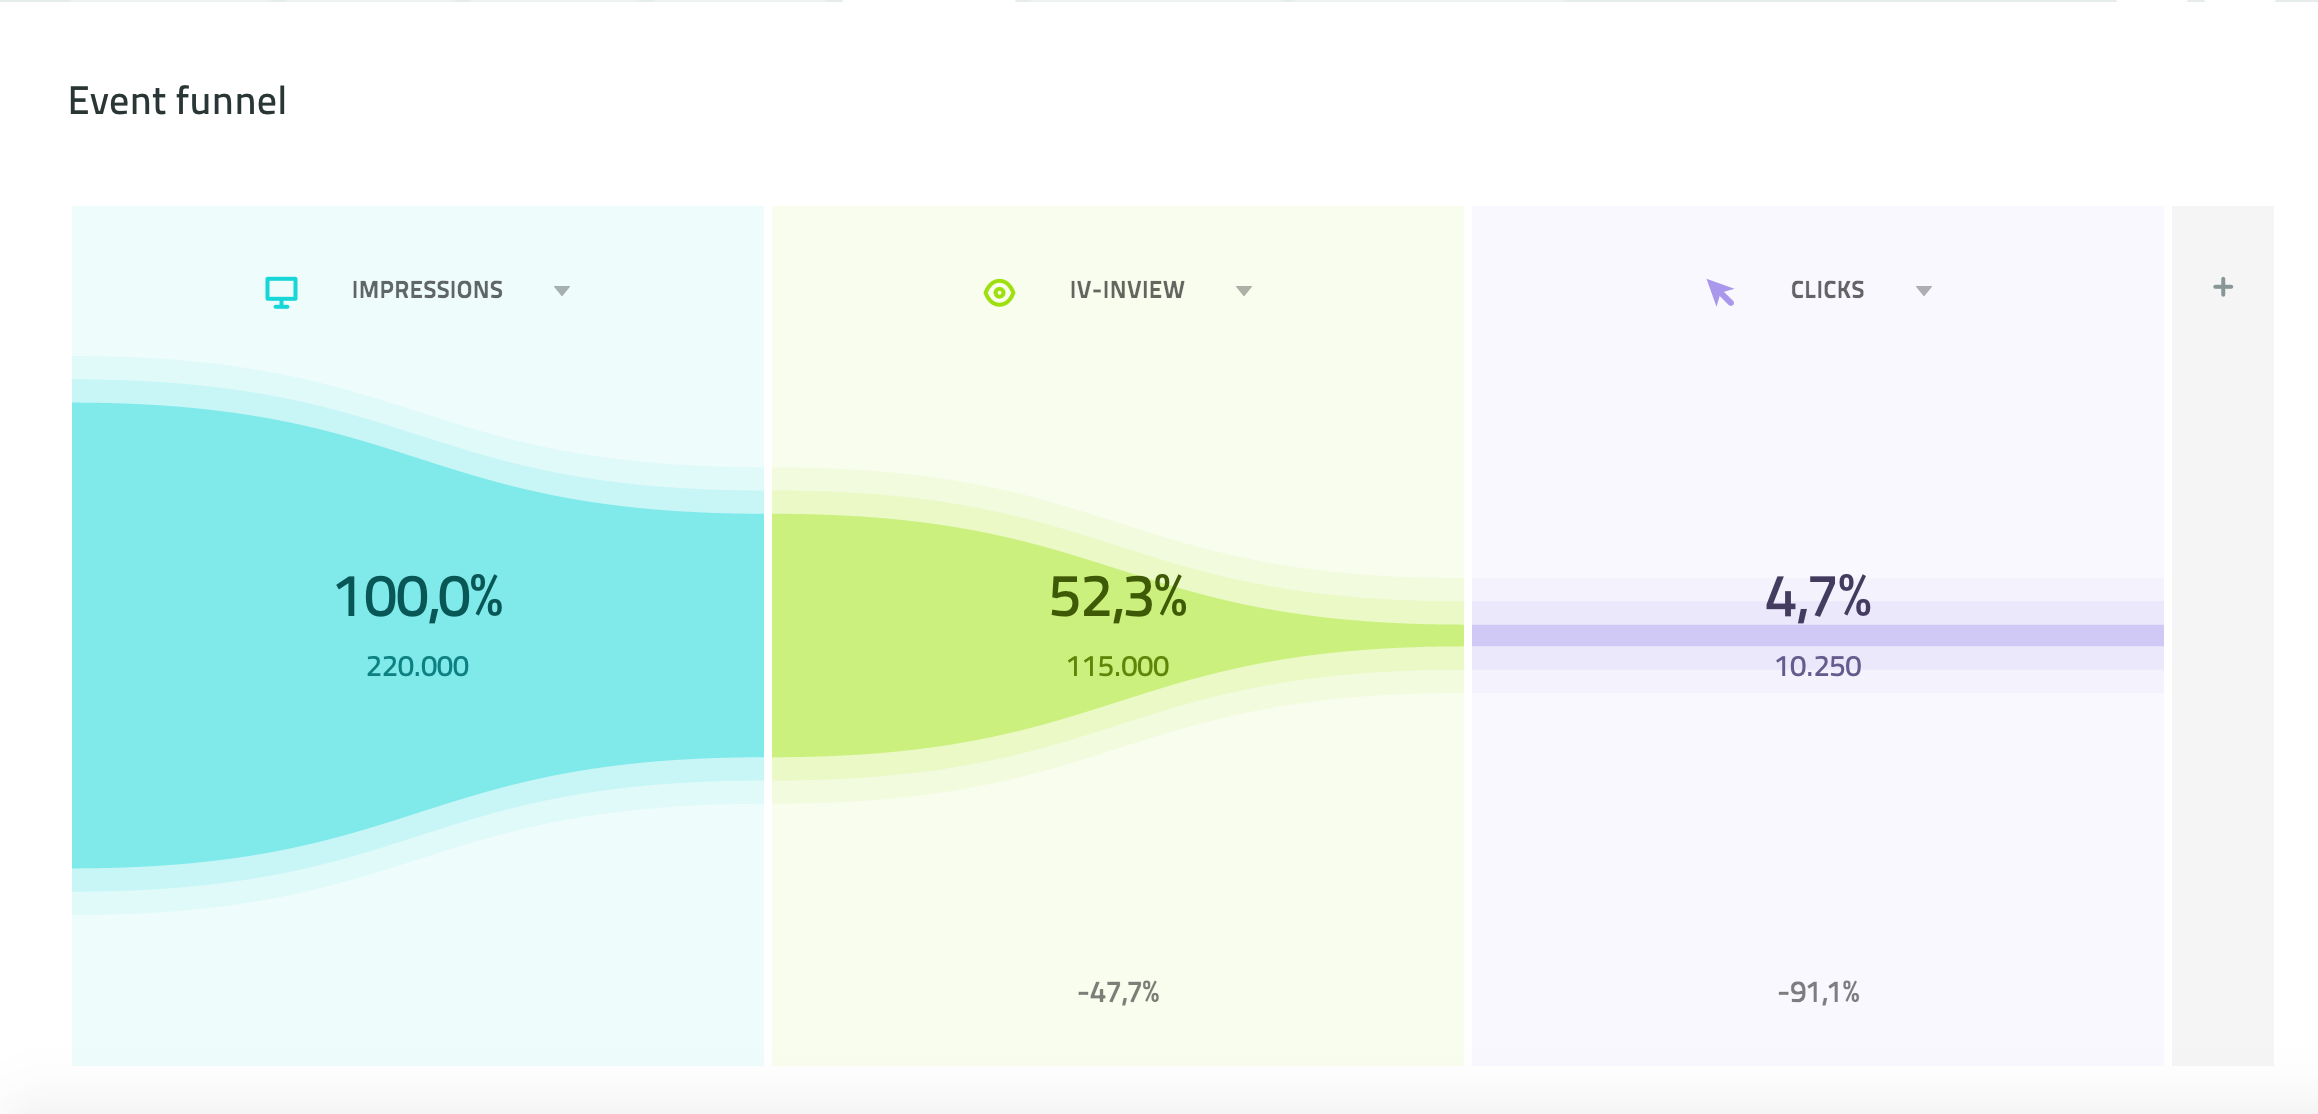
Event funnel
The event funnel will visualise the events tracked for your project.
The funnel shows the tracking for the total project. If you want to see the funnel for selected pixels only, use the filter function on the top of the page (note that it might take approximately 15 sec. before the funnel has been re-calculated).
By clicking on the dropdown in each box, you will be able to customise the funnel, as you wish.
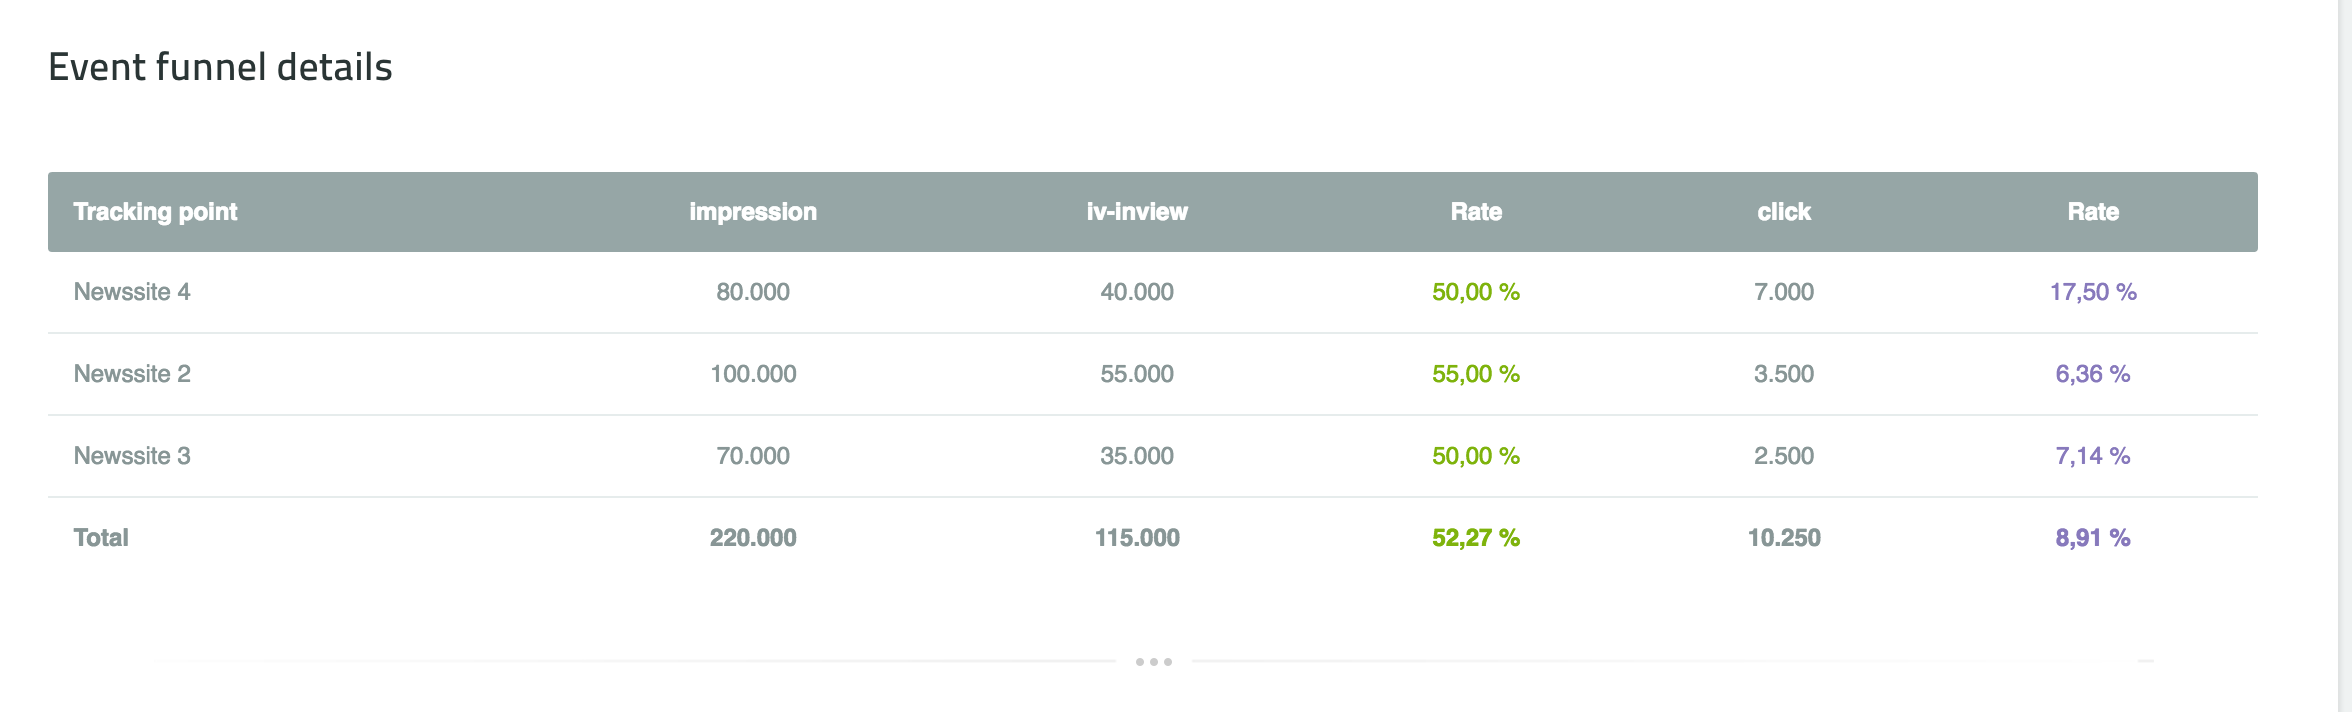
Event funnel details
In the event funnel details, you’ll find information on how the events are tracked for each of your tracking points. In this example, the events; impressions, in-view and clicks have been tracked. From the “rate” it is further evidence how big a share, has continued to the “next event”. In this example, for newsletter 4, 50% of the ones that have generated an impression has further clicked.
Event timeline
The event timeline will show how the tracking of each event has developed during your report period. In the upper right corner, you’ll be able to select for which events you want to see the development. Be aware that the graph has two y-axes, one for each event. In this case, the unit for impressions is on the right y-axis, while the unit for clicks is on the right y-axis.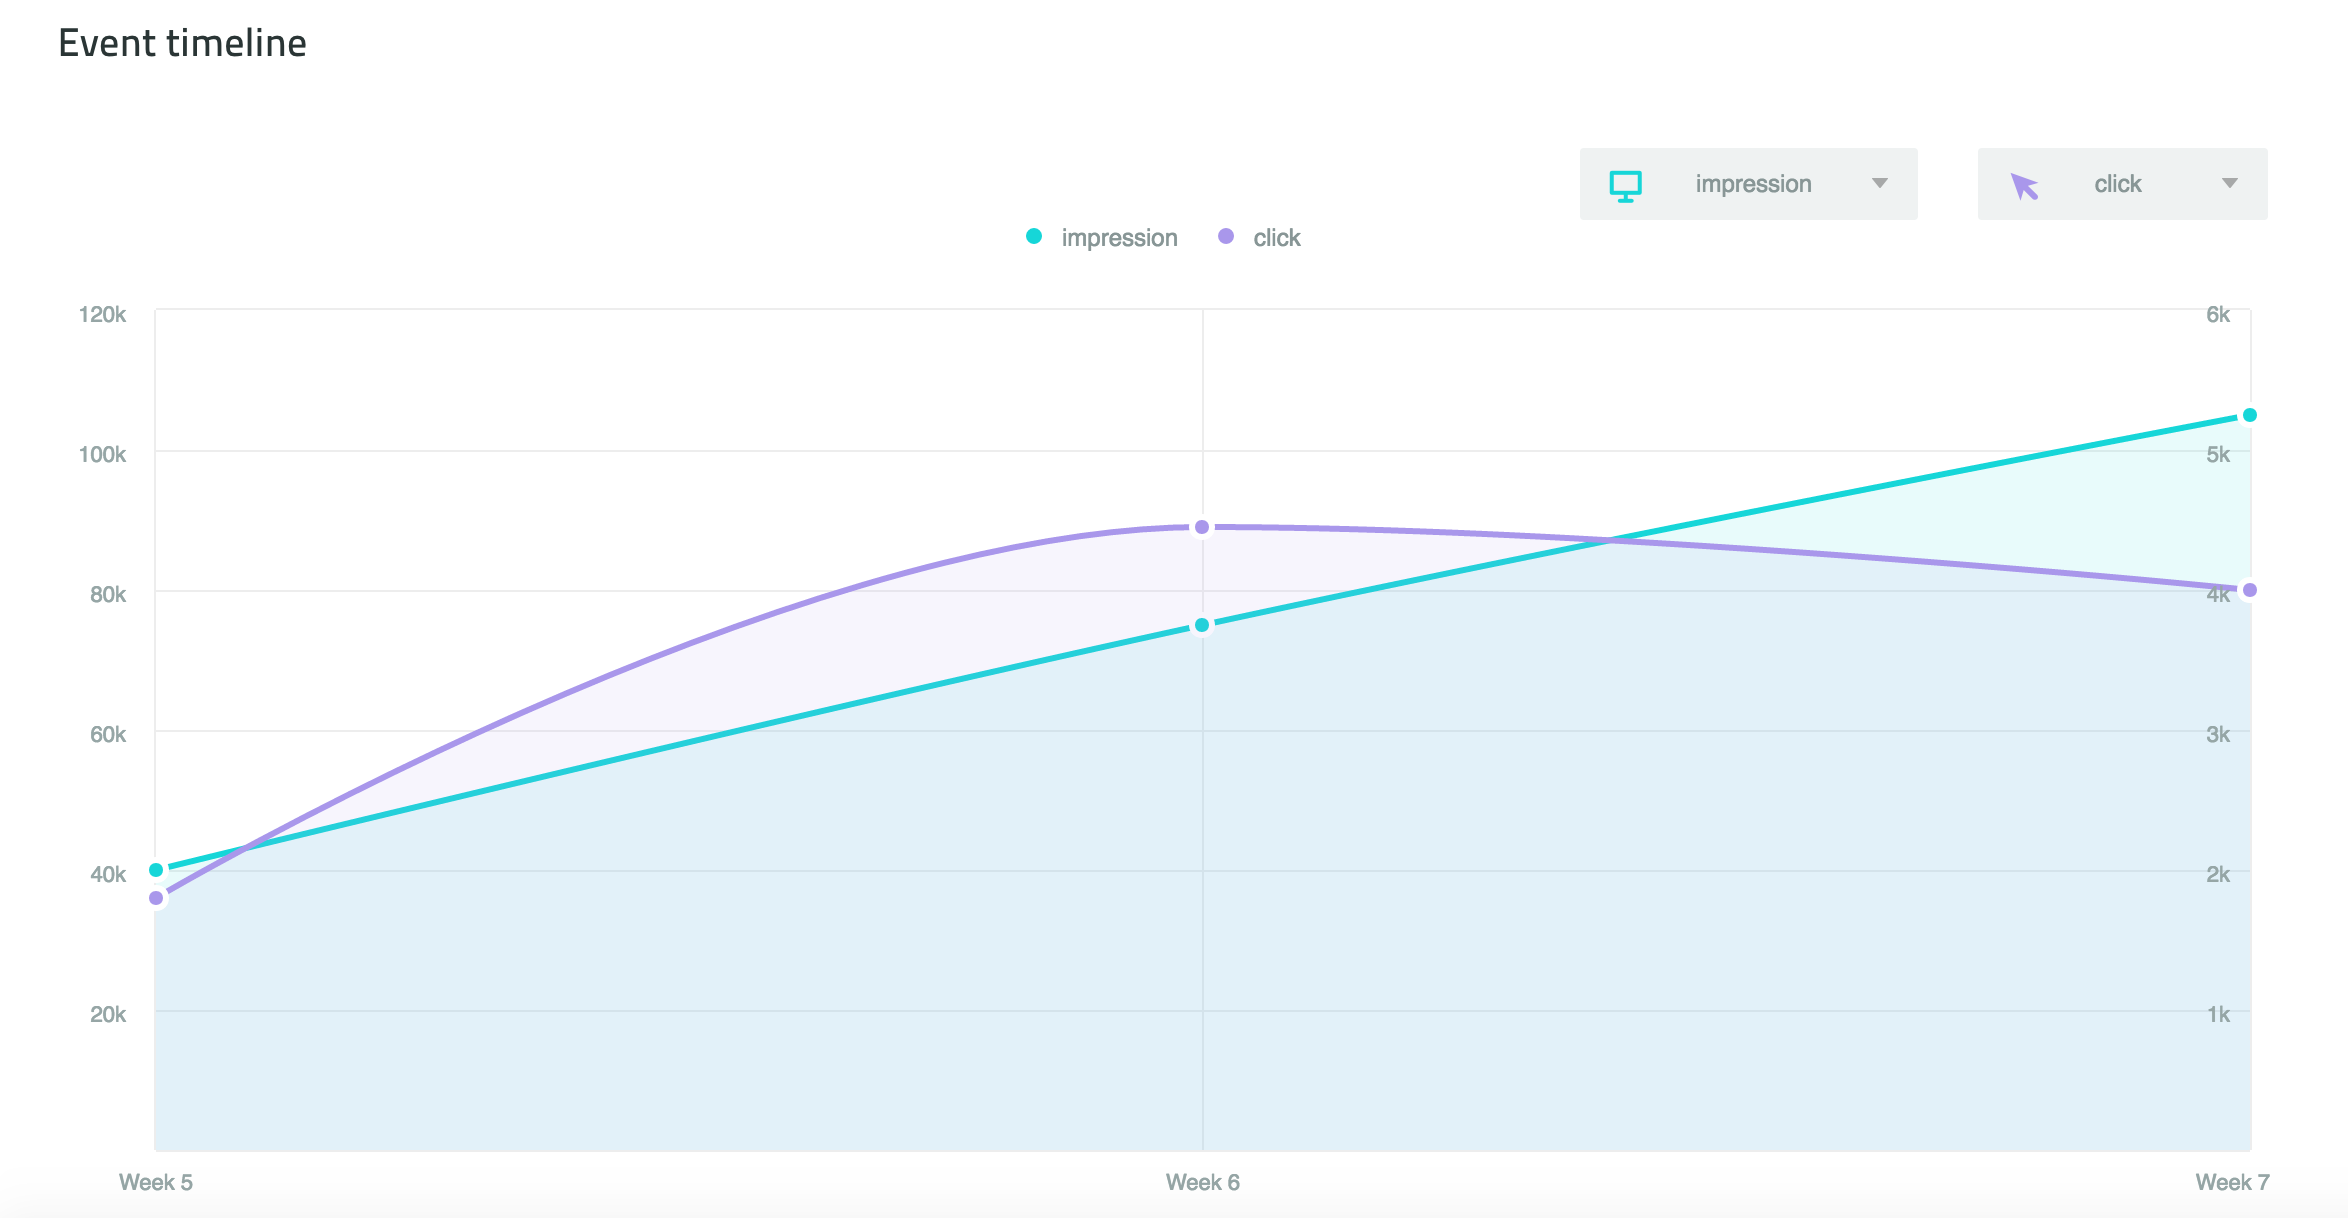
Event profiling
To see the specific profile for the events, scroll to the bottom of the events tab. Here you can see how the events(i.e. clicks) are divided by demographics: age, gender, education, employment, income, household size and whether there are children in the household. You can also see how the events are divided by your own selected custom segments criteria, like ownership, purchasing intent and so on. 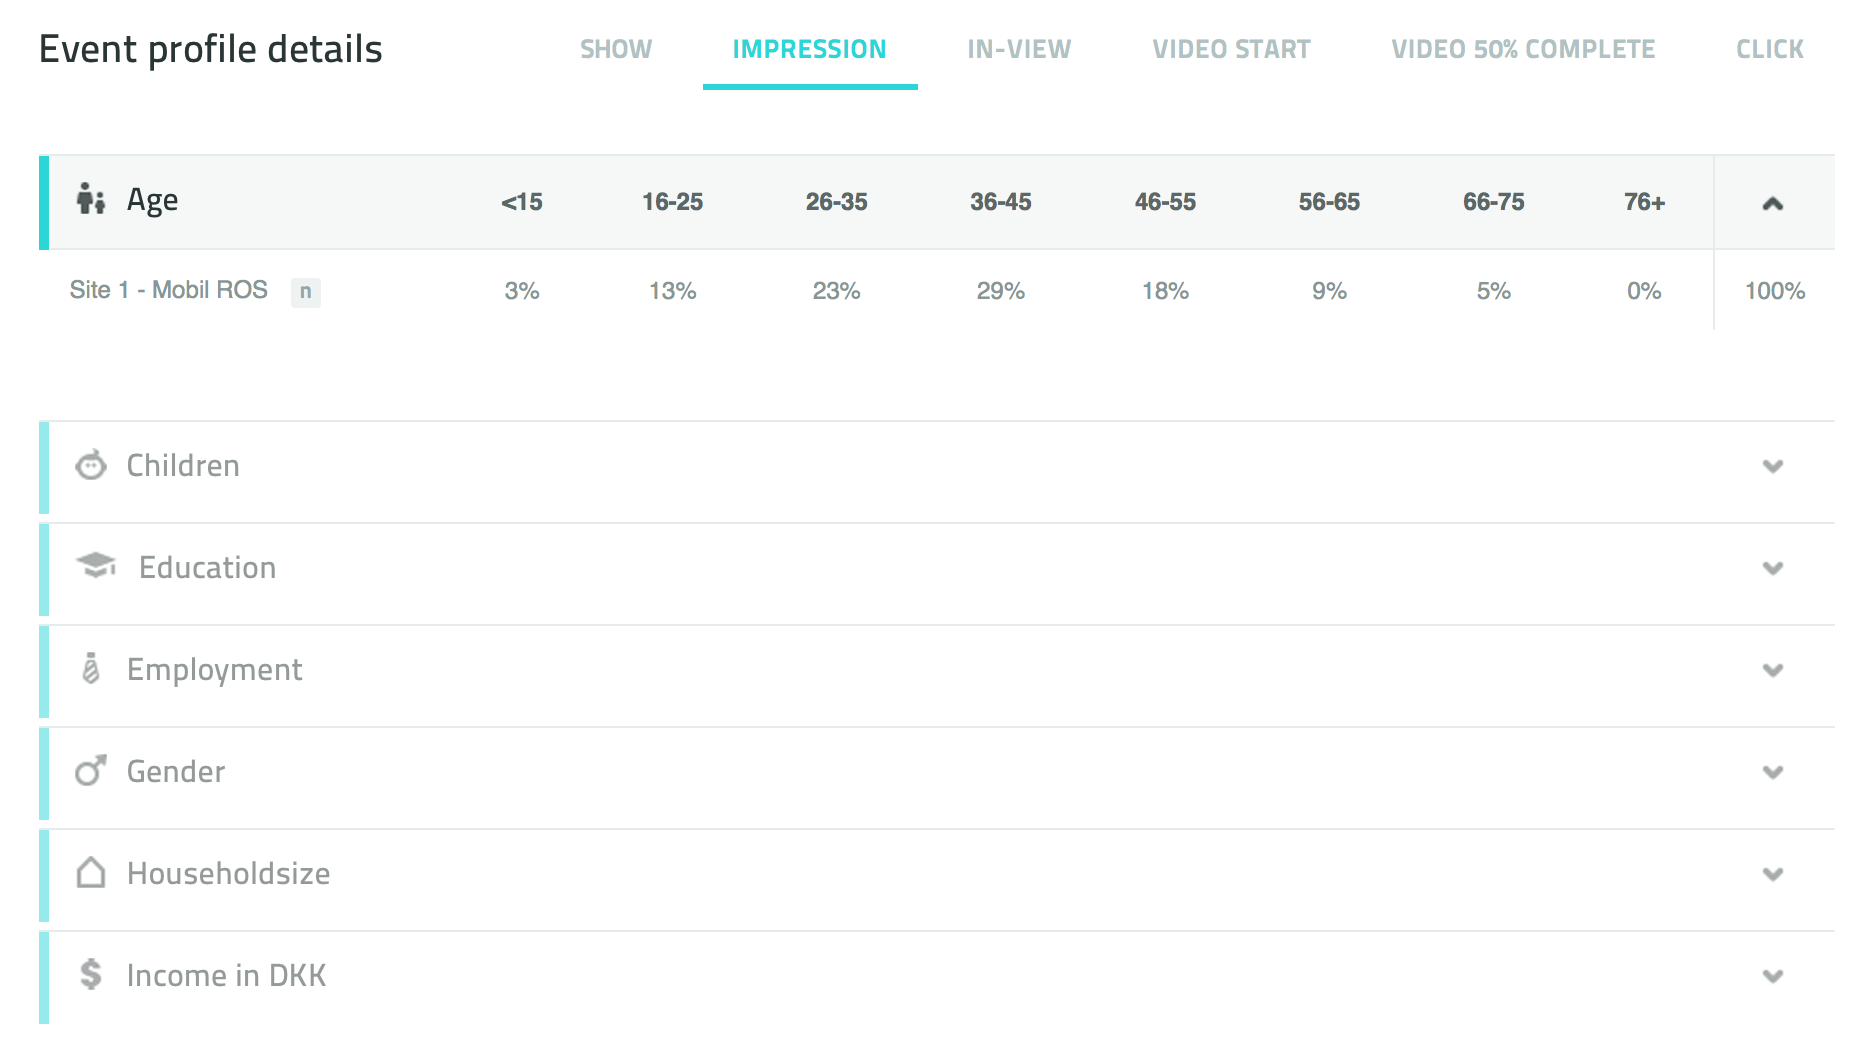
If you need help to understand your reports please contact support@audiencereport.com