AudienceData
Adserver
Best Practices
Do's and dont's when using AudienceData
How to document the accuracy?
Why introduce segments with different affinities?
Using targeting with the right conditioning
DSP
How to access data AudienceData segments in Adform
How to find AudienceData in MediaMath DMP
How to find segments in BidTheatre
How to find segments in Display & Video 360
Data Introduction
Available Segments
Existing integrations
Methodology and precision
The distinction between campaign impression profile and impressions in target group
What is deterministic data?
What is probabilistic data?
Publisher
Accessing targeted data with DFP Audience sync
AdForm publisher integration instructions
How to find data usage information in Google 360 for Publishers former DFP
How to report on AudienceProject segment usage in DFP
Inventory available for realtime targeting in DFP
Lotame integration
Sending targeting key values to AdManager
Troubleshooting
AudienceHub
How to create your first audience
How to create your first seed
Case 1: Selecting a customer file
Case 2: Selecting an Amazon S3 file
Case 3: Selecting survey data from UserReport
Creating a seed
Insights reports
What is AudienceHub?
The new generation of AudienceReport
API Documentation
API Best Practices
How do I use the AudienceReport Next API?
Understanding the API documentation
What is an API?
Where do I find the API key?
Account Management
Account Types
Agencies: managing user access for connected accounts
How to add new clients
How to connect an Agency account to a Premium client account and vice versa
How to disconnect accounts
How to manage user accounts
User roles
What is the 2-step verification and how does it work?
Integrations
Adform
Amazon Ads
CTV and Addressable TV
Campaign Manager
DV360
Facebook/Meta
Semi-Automated integrations
TechEdge Integration
YouTube
Measurement Methodology
Pixel Implementation
Getting Started with Pixels
How do URL-Parameters work?
How to add parameters to AudienceReport pixel
How to check if your pixel is firing?
How to create a pixel?
SSL - Compliance
The GDPR parameters
What is a CACHE-Buster and why do we need it?
What is a tracking pixel?
What is the purpose of a t-code?
Setting up Pixels
Pricing
Reports
Creating and Sharing reports
How to add and export tracking pixels to your reporting items
How to add custom report items
How to duplicate a report
How to export your report
How to share your report with your client
How to understand your report
How to understand your report - Dashboard
How to understand your report - Delivery
How to understand your report - Funnel
How to understand your report - Profile
How to understand your report - Reach
How to use an exported pixel
Getting Started with Reports
The original AudienceReport
Addressable TV
Activating Addressable TV measurement
Available Addressable TV device types
How Addressable TV is measured
How to get the Addressable TV measurement tool in AudienceReport
Impact on sample size and frequency
Sharing Addressable TV measurement numbers with TechEdge
What is Addressable TV?
Adserver Implementation
Ad Tech
Adserver - Adform
Adserver - VideoPlaza
Atlas
Double Click DCM Adserver
Emediate
Extented Sizmek Asia-guide
How to implement creative wrapper in Ad Manager
Programmatic Publisher Ad Server - Adform PPAS
Setting-up video measurement in Google Ad Manager
Sizmek Ad Suite Tracking
Sizmek/MediaMind guide
Tracking using JavaScript
Implementing AudienceReport tracking pixels in Webspectators
Brand Lift Studies
Cache-buster
Is my cache-buster working?
What is a cache-buster?
Which cache buster shall I use for my ad server?
Why do we need a cache-buster?
Creating Projects
Adding tracking points / pixels to your project
Applying filters to your data
Change your target group or report period
Creating your first project
Duplicating campaigns
How to merge projects
How your data will change when applying filters
Custom Segments
Activating your Customer Segments 3.0
Available Custom Segments
Custom Segments 3.0
Custom Segments and Sample Size
Reach, Coverage and Segments Availability
What are Custom Segments?
Event Tracking
Adding tracking points / pixels with event tracking to your project
Event tracking in various adservers
Implementing click trackers
In-app tracking
In-view tracking of inlined content
Understanding Event Tracking
What is Event Tracking?
Integrated Report
Connect your Facebook Business Manager account to AudienceReport
Connect your Google Ads account to AudienceReport
Connect your Google Display & Video 360 account to AudienceReport
How are data integrated?
How to create an Integrated Report
To-do list before creating an Integrated Report
Understanding your Integrated Report
What is an Integrated Report?
Integrations
Adform integration set-up
Automatic tracking of DFP campaigns
Google Campaign Manager Integration
Integrate AudienceReport and Techedge AxM (AdvantEdge Cross Media)
Intercept
Pixel implementation
Quality
How Transparency is measured
How Viewability is measured
How the Overall Quality Score is calculated
Viewability tracking using AudienceReport measurement script
What is Quality?
What is a good Quality score?
What is a hidden referrer or a generic referrer?
What is the difference between no referrer and other referrers (in the tracking point violations table)?
When is a tracking point considered to be violating Geo Compliance/Transparency/Viewability?
Why can’t I drill down on some countries to see in which regions my impressions are loaded?
Why is my overall score not that bad when almost all my impressions are of low quality?
Why is there a discrepancy between the impression count in the Quality tab and the rest of the report while my campaign is running?
Will my viewability score of 0.0 affect the overall Quality score if I didn’t implement in-view tracking?
Reports
Customized PDF reports
Deeper Insights with Campaign Audience Measurement
Exporting your report
How to search for your project
Introducing the common affinity profile
Managing your projects with labels
Sample sizes
Tired of clicks and imps?
Understanding your project
Technical Questions
Account Administration
Ad blocking
Can I change the phone number I chose for the two-step verification process?
Checking SSL-Compliance
General Troubleshooting
Getting started with AudienceReport API
How do URL-parameters work?
How often will I be asked to log in through the two-step verification process?
How to track traffic by device type
If you accidentally delete pixels from your project
The procedure to enable the two-step verification
What if I lose my phone and cannot access my account?
Tracking Pixels
Upgrade to the new generation of AudienceReport
AudienceReport Upgrade FAQ
Comparing the original and the new generation of AudienceReport
How to import data from the original AudienceReport
UserReport
Installing UserReport and setting up your media sections
Defining your website in the media section
General Account Information
Installing UserReport on your website or app
Adding own user ID to UserReport
Configure Google Tag Manager to resolve media dynamically
Configuring media/section through snippet
Install UserReport script with Google Tag Manager
Installing UserReport SDK to Android Application
Installing UserReport SDK to iOS application
Installing UserReport script on your website
Kits
General Information
Reach and Coverage of Custom Segments
Target Audience verified by Kits
The technology behind Kits
What are Kits?
Getting started
Troubleshooting
Working with Kits
The feedback widget
Activate the Feedback widget
Adding context information to ideas and bugs
Customize Feedback widget buttons and links
Customize color, text and position of the Feedback widget
Disabling the Feedback widget on specific devices
Get direct link to the Feedback widget or manually display it
How to activate your Feedback widget
How to change the status of an idea or add a comment
How to disable the "report a bug" feature
Is the Feedback Forum available in my language?
Pre-populating username and email
What is the Feedback widget?
The feedback report
The survey widget
Activate Email Collect
Activate Net Promoter Score ®
Activate the Survey widget and create your questions
Chained questions and how they work
Controlling invitation frequency when using UserReport script and Google Tag Manager
How many questions can be added?
How many surveys answers do I need?
How to add questions to your survey
How to customise you survey widget
How to deactivate and delete your survey questions
How to show or hide results from users
Is UserReport 100% free?
Is the UserReport survey widget available in my language?
Managing invitation rules through Ad-server
Preview your survey
Respecting the user
User invitation to UserReport survey and the quarantine system
Who pays for the prizes in the survey?
Will UserReport slow down my website? Is it affected by popup blockers?
The Google Analytics Integration
The survey reports
Accessing Newsletter signups using API
- All Categories
- The new generation of AudienceReport
- Integrations
- Semi-Automated integrations
- Integrate with Semi-automated integration
Integrate with Semi-automated integration

Semi-automated integration is a feature that allows you to easily track your campaigns at scale without using one of our predefined integrations. We have automated the process if you wish to measure your campaigns at scale, but work on an ad server for that we do not have a direct integration yet. This means, that semi-automated integrations make it possible for you to achieve a scalable tracking solution without an AudienceReport predefined integration.
We currently support semi-automated integrations to the following platforms: Freewheel, Xandr, SpotX, Sizmek, Spotify, Flashtalking, MediaMath, Adform, Google Ad Manager, Campaign Manager, DV 360, and The Trade Desk.
If you wish to get a semi-automated integration, please reach out to your Customer Success Manager.
Add a new semi-automated integration
In order to create a new semi-automated integration, you could achieve this by either clicking on the “Manage” button under the Items page
or the link “Semi-automated integrations“ under the profile menu
Regardless of which option you choose, you will be directed to the dedicated page for Semi-automated integrations.
To create a new semi-automated integration, you just click the “+ Add new” button. Then you’re prompted with the setup wizard with an introduction step explaining how to use the feature.
Introduction
The purpose of semi-automated integrations is to automate the process of creating custom items and implement tags each time you want to measure a campaign with AudienceReport. Please note that each client has their own tag. In order to proceed to the next step, simply click either the “Get started“ or “Next: Setup“ button.
Setup
As a first option in the setup step, you’re prompted with a list of the platforms we currently support. These are Freewheel, Xandr, SpotX, Sizmek, Spotify, Flashtalking, MediaMath, Adform, Google Ad Manager, Campaign Manager, DV360, and The Trade Desk. Additionally, you can create your own platform and integrate it with AudienceReport. Depending on the selection, AudienceReport will automatically generate the corresponding macros for each platform.
In the same step, you will also be able to select the clients for which will be possible to measure and download tags, as well as, the events you wish to measure tags.
Once you complete the setup step, you will be able to proceed to the next step by clicking the “Next: Macros“ button.
Macros
In this step, you are able to configure the appearance of the created items and enter relevant macros. In this example, SpotX has been selected as the platform to set up a semi-automated integration. In this case, AudienceReport prepopulates the corresponding available macros such as ID Macro for the campaign as well as additional macros for Advertiser ID, App ID, Mobile Ad ID, IP Address, URL, and Cachebuster. You are able now to update/edit the macros or add new ones by clicking on the “Add parameter“ button. You are also able to control the granularity and appearance of the items created in AudienceReport by adding more levels.
The outcome of the first section called “Item level macros“ allows you to define how the item would look when ingested in AudienceReport.
The outcome of the second section called “Additional macros“ allows you to collect more parameters in the measurement request so we have the most advanced measurement possible.
There is also the ability to add a parameter if it doesn’t exist. By clicking the “Add parameter“ button, you are prompted with a modal window to insert a parameter name and corresponding macro. These will be inserted into the tracking pixel.
Next click on the “Next: Mappings” button to proceed with the next step.
Mappings
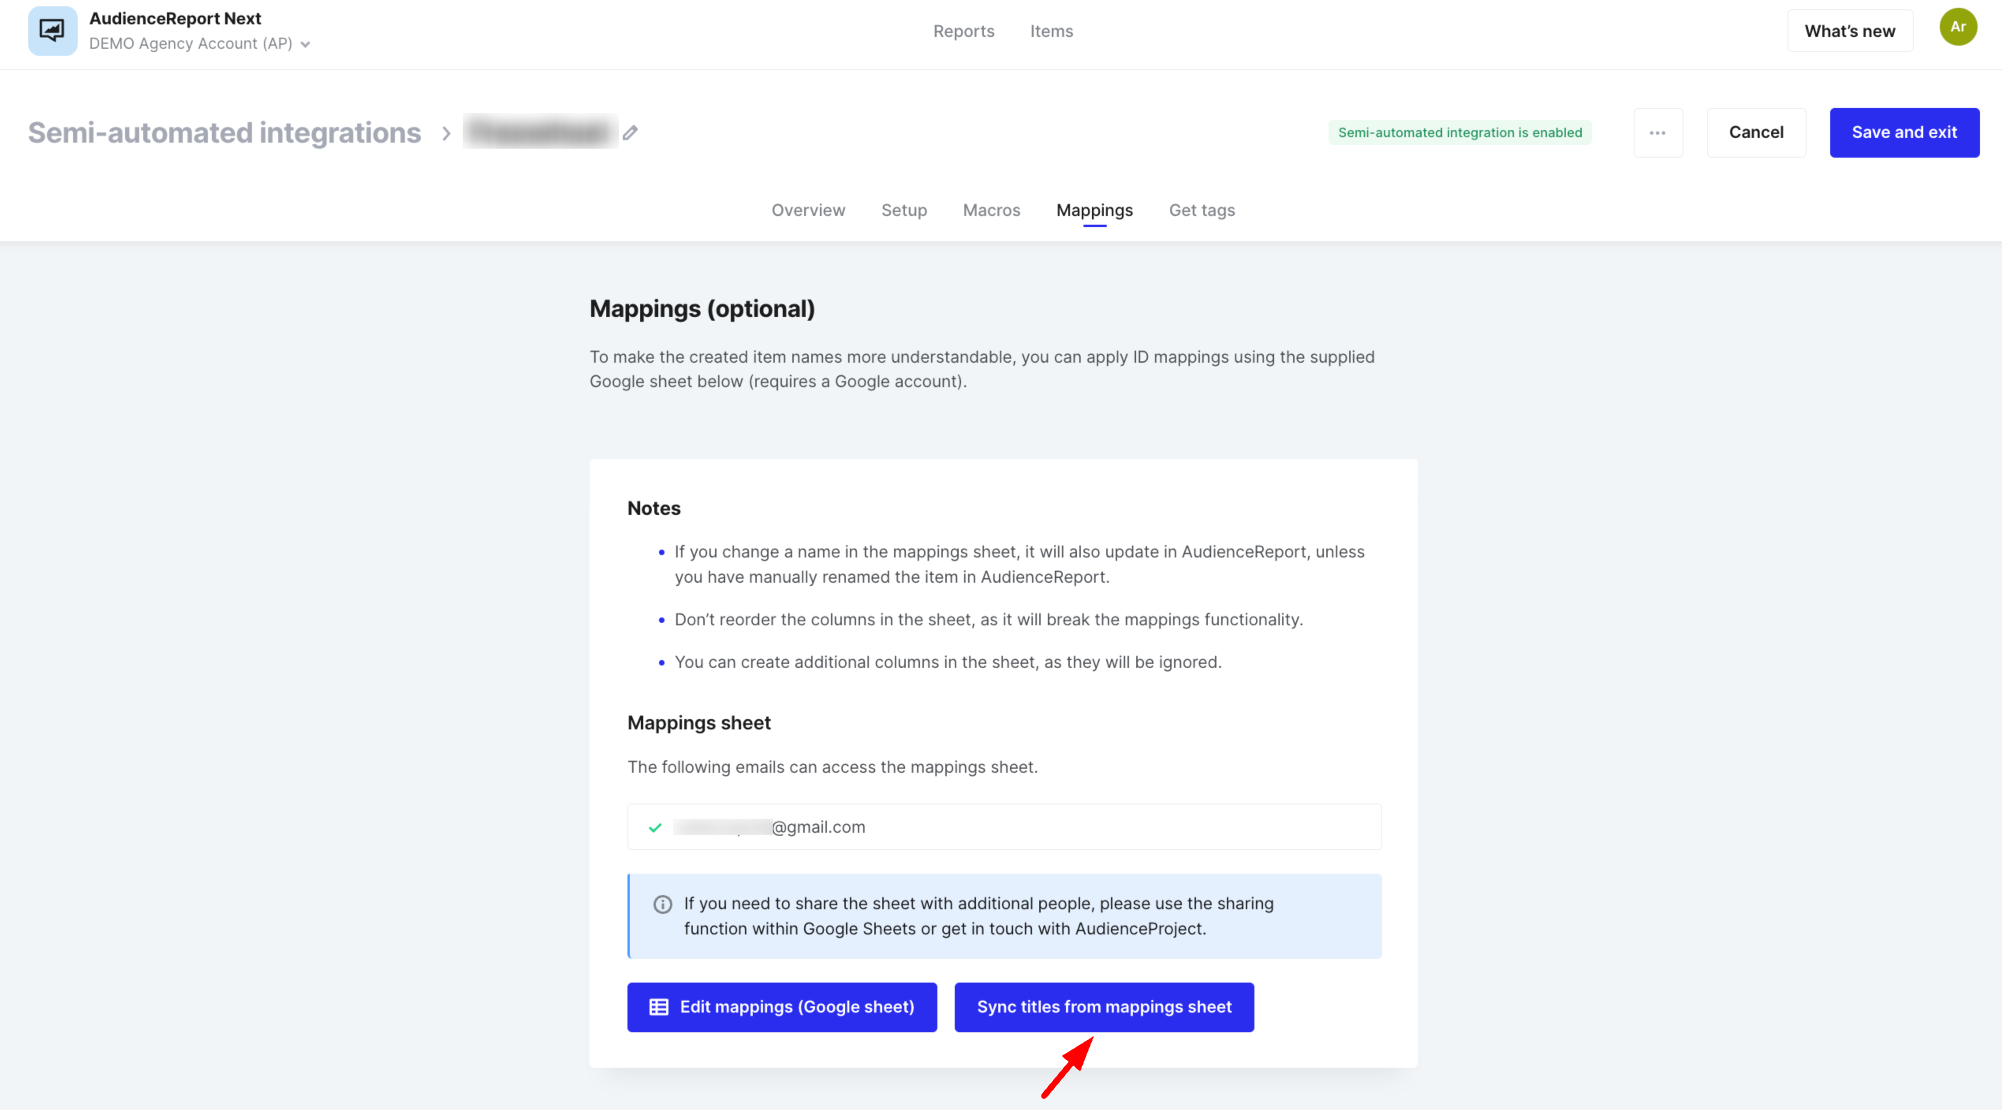
In this step, you are able to apply ID mappings using a Google sheet for convenience and in case you wish to work with mappings at scale. You are able to invite users to get access to the spreadsheet/mappings sheet in order to edit it.
Also, an email is silently sent out to the CSM team at csmgroup@audienceproject.com so they are able to get access to the file in case an employee is not able to access it anymore or ownership of the file needs to be transferred.
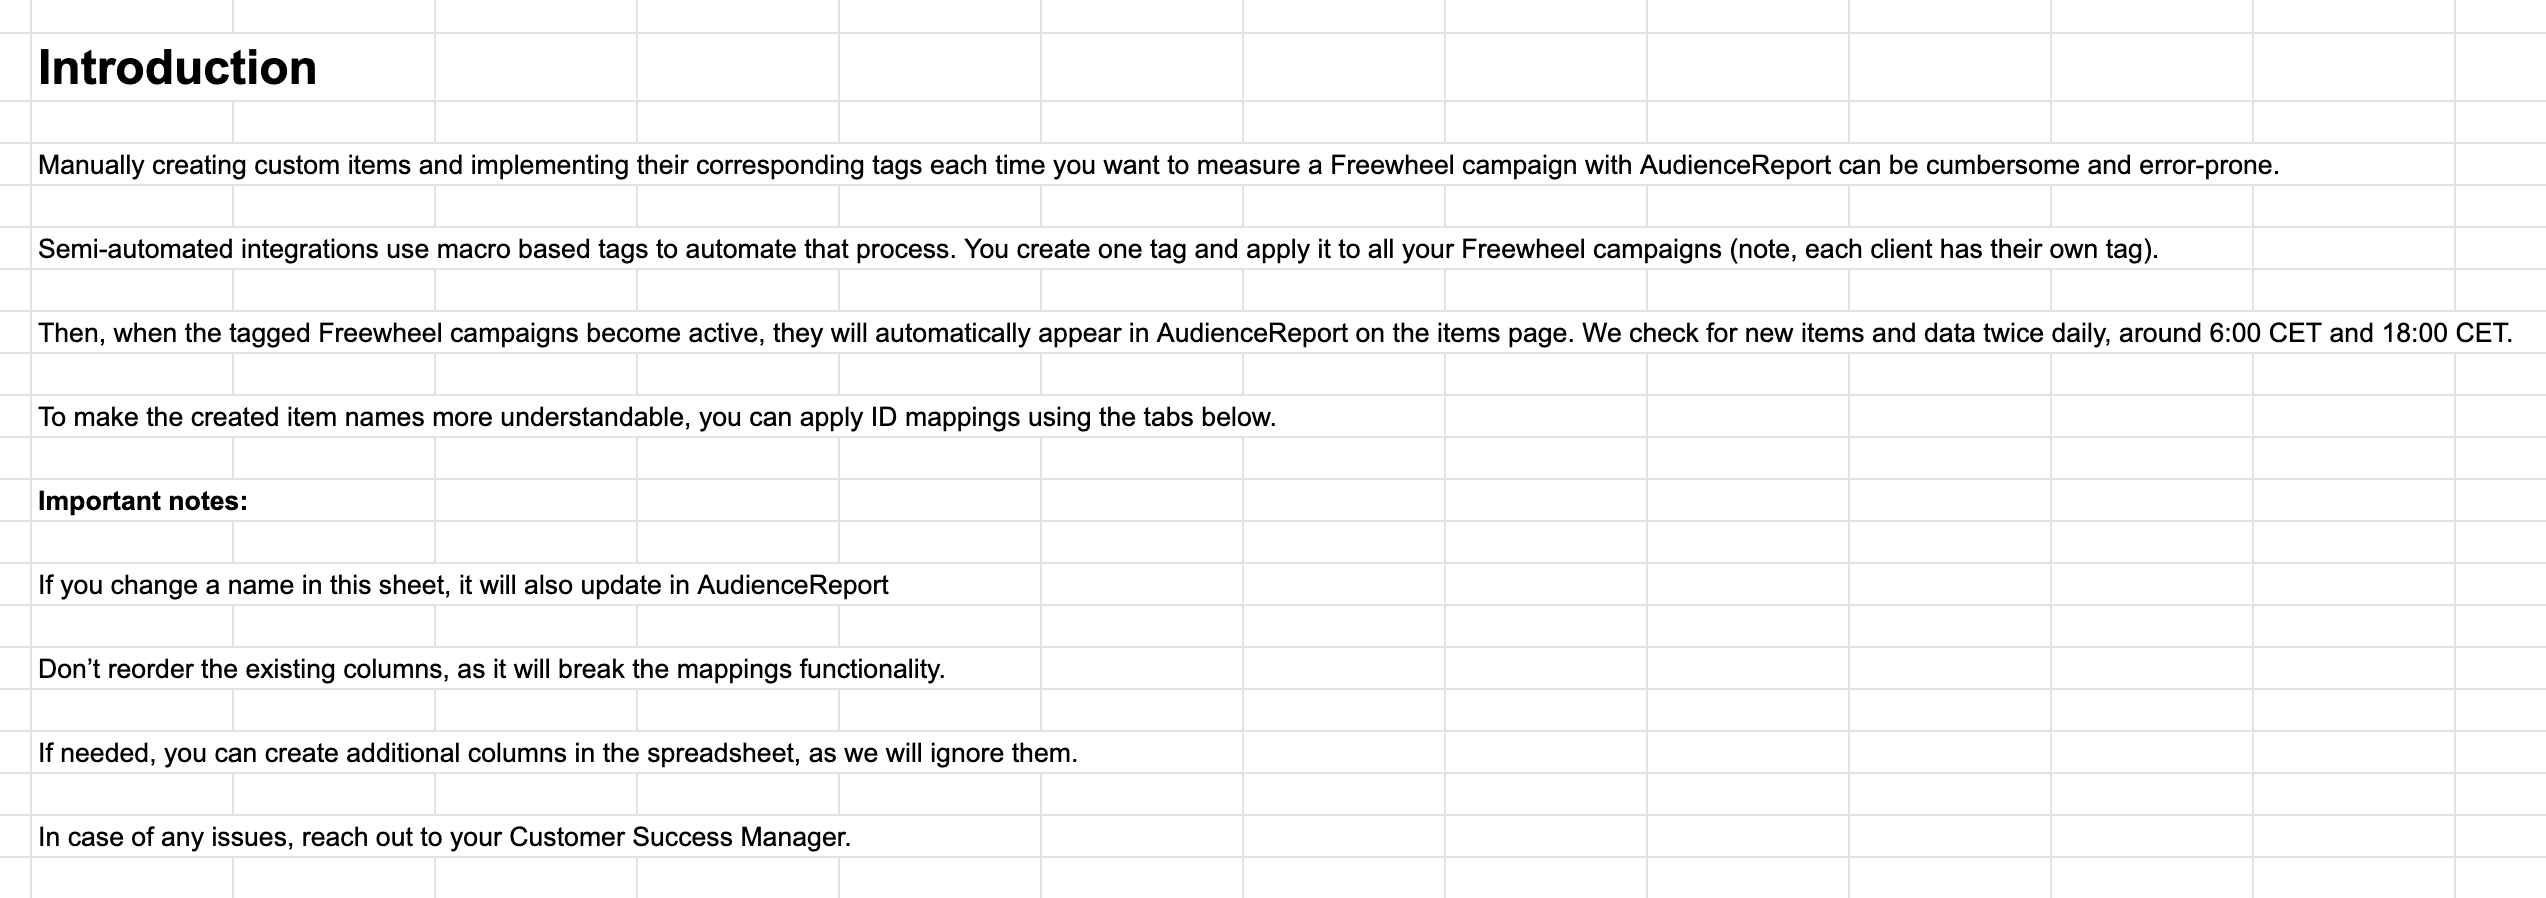
In this example, a relevant mapping sheet is created and is used to make the created item names more understandable by applying the corresponding ID mappings. In the first sheet called “Introduction“, you can find all the relevant instructions on how to use the mappings
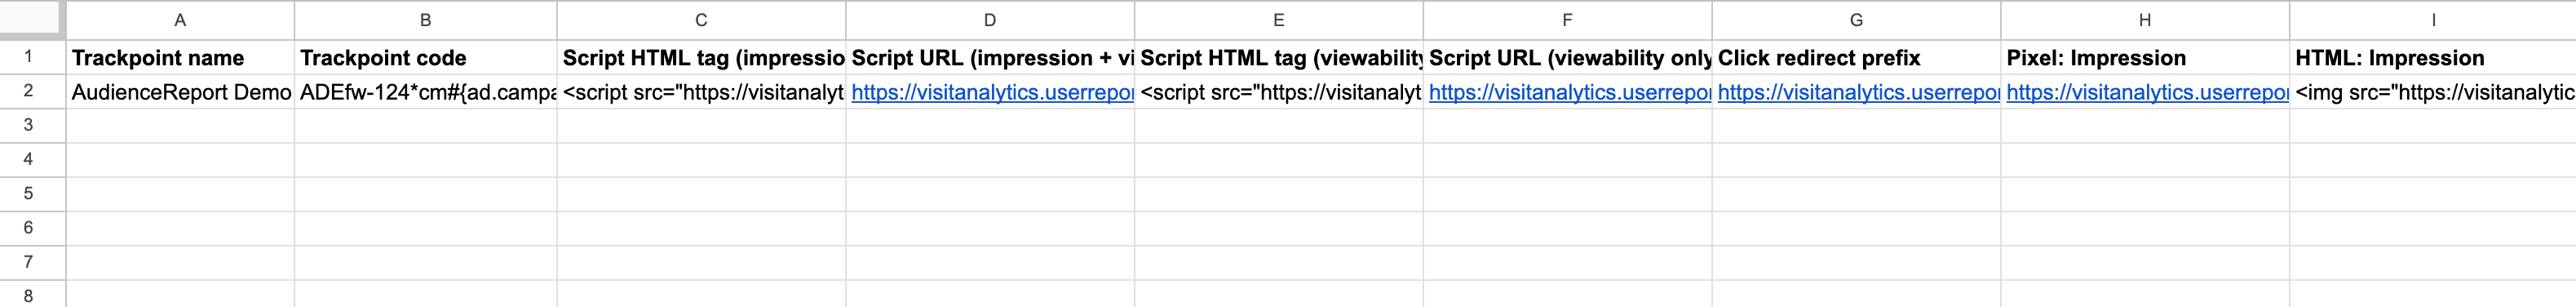
Below there is an example of various campaign IDs along with their corresponding campaign names that are being measured in AudienceReport coming from a semi-automated integration with Google Ad Manager (as an example). You should add Campaign ID(s) and Campaign name(s) to the sheet manually.
If you wanna change the name(s) of campaigns/line items/etc in the list please click the ‘Sync titles from mapping sheet’ button after you change them. We are of course updating the names automatically after we receive new events for that campaign, so the button ‘Sync titles from mapping sheet’ was created simply to speed up this process.
Implementation of the Tag
In the spreadsheet in the tab called 'Tags', you can find the tag created for your client. You have to take the needed format of the tag and implement it in your Adserver.
Some examples:
For DV360: you have to add pixels to each creative. HTML or Script format for Display campaigns, Pixel: Impression for Video ones.
For Adform: you have to add pixels to each tag
For Campaign Manager: you have to add pixels on the advertiser or campaign level
etc.
Reporting of Semi-automated integrations
Every time an ad is delivered and a pixel is fired, AudienceReport identifies the data coming from the ad server and measures it.
In terms of reporting, it works like any other direct integration of AudienceReport. This includes all relevant metrics:
- Reach in target group
- Frequency
- Hit rate
- On-target percentage
- Events in the target group
And all relevant demographics:
- Gender
- Age
- Income
- Employment
- Education
- Household size
- Children in household